| Author |
Message |
Bree
Newbie

Joined: 11/12/2009
Location: AustraliaPosts: 6 |
| Posted: 12:42am 13 Dec 2009 |
 Copy link to clipboard Copy link to clipboard |
 Print this post |
|
Hi All
I am at the stage where I am about to bring my home online, Aquaponics, weatherstation and my solar power, I have been looking at interface options around the net and a common thread seems to appear, "how to monitor the fonius inverter" at a reasonable price, the datalogger prices i think are excessive. Well there others doing it around the world, the card they use is a Fronius Interface Card Easy, thats its name and it has an open RS232 output, meaning the correct software can read it, I have found some software already custom written but would maybe like to start a topic to see what we can do for all the people with these inverters, the card I believe is under 200 dollars but am having trouble getting it here in OZ but OS seems to get it, there are other cards that show promise as well, who's interested?
Bridgette

you only get one go at it ! |
| |
GWatPE
Senior Member

Joined: 01/09/2006
Location: AustraliaPosts: 2127 |
| Posted: 05:14am 13 Dec 2009 |
Copy link to clipboard |
Print this post |
|
Hi Bree,
Do you have info on the data string output on COMMS from the Fronius inverter?
A program should be doable along similar lines to the piclog application.
I will see what I can find out. What sort of data would you like to monitor and at what rate? Would you need graphing and .csv outputs?
Gordon.
PS edit:
I have looked for info on Fronius site. Not much luck!
I think you will need to get a COMMs unit and go from there. This is how I went about logging on the CurrentCost units, until the company published for the CC128.
Good Luck with your search.
Edited by GWatPE 2009-12-14
become more energy aware |
| |
Bree
Newbie
Joined: 11/12/2009
Location: AustraliaPosts: 6 |
| Posted: 06:02am 13 Dec 2009 |
Copy link to clipboard |
Print this post |
|
Hi Gordan
Yes I have the info on the inverter configuration and the addresses, I also have a program written in VB that someone in america wrote a couple of years ago as well that worked on one that was written for Linux.
I used to program C, C++ and ASM in a different life along time ago, but most of it is gone now and im trying to re aquaint myself with it as well as a history in RF and Digital electronics, also a long time ago, any help would be greatly appreciated, i could send u the file to look at if you like. Downloade visual studion 2008 the other day the try to do something but.......
Bridgette
you only get one go at it ! |
| |
Bree
Newbie
Joined: 11/12/2009
Location: AustraliaPosts: 6 |
| Posted: 06:31am 13 Dec 2009 |
Copy link to clipboard |
Print this post |
|
Here are somelinks I came across
This is the card i was talking about but they also have another comms card that i believe could be used.
http://www.fronius.com/cps/rde/xchg/SID-8738AFE6-0DEB949F/fr onius_usa/hs.xsl/2714_1456.htm
from page 25 is the comms protocol
http://www.fronius.com/cps/rde/xbcr/SID-664EC804-F2BE1E4F/fr onius_usa/4204101343_BA_0108_fronius_ig_interface_card_easy_ de_en_fr_it.pdf
Link to linux version
http://www.jeremysimmons.com/
http://sourceforge.net/projects/fslurp/reviews/
And this is the VB script that works for him - good
http://theconnectedhome.biz/Solar.html
I also have a comms manual somewhere that ill look for
you only get one go at it ! |
| |
GWatPE
Senior Member
Joined: 01/09/2006
Location: AustraliaPosts: 2127 |
| Posted: 01:13pm 13 Dec 2009 |
Copy link to clipboard |
Print this post |
|
Hi Bree,
The links reference binary files and do not give any indication of the data string that may be output from the inverter.
I set up a COMM sniffer, that recorded say 1000 characters from the COMM port, and displayed on screen. Was then a matter of decoding the string, once the COMM settings had been sorted.
This may still be the best solution. Problem is my inverters are SMA, and SER COMMS are probably different.
I would use the PICAXE programming application to read the port. F8 will allow display of downloaded data from the port and allows BAUD etc to be changed. This will give some indication of the output data string format.
Once the format is known, a suitable VB application can be written to make the data more useful. I use VB6. I have VB.net but have not been able to get data plotting to work yet.
Gordon.
become more energy aware |
| |
KarlJ

Guru

Joined: 19/05/2008
Location: AustraliaPosts: 1178 |
| Posted: 01:05pm 14 Dec 2009 |
Copy link to clipboard |
Print this post |
|
I like the idea but realistically you have a smart meter which tells you on-screen and your powerbill will be itemised into chunks of the day, everyone I know with the sunnyboy, reads it for interest the first few weeks then looses interest, after all there's not muc you can do to change anything!
Karl
Luck favours the well prepared |
| |
Bree
Newbie
Joined: 11/12/2009
Location: AustraliaPosts: 6 |
| Posted: 08:20pm 14 Dec 2009 |
Copy link to clipboard |
Print this post |
|
Hi
Yes I know most will do that, but for me its a two fold thing, it gets me back into programming and in the right mindset, and its something I have always wanted to do for a couple of other reasons, wanting to bring my home fully online as well, Im one of those people who needs a mission and a plan, quite onsessive really. Now have looked at the specs in the manual I posted the links for and studied their expectations in the rs232 stream as well as the extraction programs I have found on the net, think I have it all sorted, even found a card but now looking for a cheaper source for them and still trying to get used to VB.net, heaps of fun and time wasting
Bridgette
you only get one go at it ! |
| |
GWatPE
Senior Member
Joined: 01/09/2006
Location: AustraliaPosts: 2127 |
| Posted: 12:43am 15 Dec 2009 |
Copy link to clipboard |
Print this post |
|
Hi Bree,
For the cost of the COMM board for the Fronius, you could get a 3 channel Current Cost meter under $200.
You would then be able to compare the recorded solar day to day and 2 other channels as well.
Here is a graph output from a 6channel unit. I have made a VB6 app.
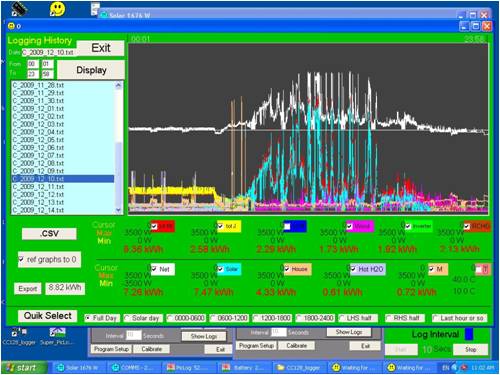
Logging the Fronius for only power does not give much info. Comparing house consumption to solar and OFF peak hot water etc is more informative
Gordon.
become more energy aware |
| |
Bree
Newbie
Joined: 11/12/2009
Location: AustraliaPosts: 6 |
| Posted: 07:21am 18 Dec 2009 |
Copy link to clipboard |
Print this post |
|
Is thisw the one
http://cgi.ebay.com.au/Current-Cost-ENVI-Wireless-Energy-Mon itor-Power-Meter_W0QQitemZ120506136907QQcmdZViewItemQQptZAU_ Gadgets?hash=item1c0eb9b94b
there is something smilar at jaycar but not the cc128 or its rebadged
you only get one go at it ! |
| |
Bolty

Regular Member

Joined: 03/04/2008
Location: AustraliaPosts: 81 |
| Posted: 09:31pm 18 Dec 2009 |
Copy link to clipboard |
Print this post |
|
Hi Bree
I am a friend of Gordon and see him many times a week, as we live close to each other. He may not be able to answer you for a few weeks, as he is having a holiday.
I have a Current Cost Classic, exactly the same as Jaycar sells. It monitors 3 channels whereas the the one you referred to (in your link above) monitors 10 channels, although you do need to buy extra clamps. The originals only come with one clamp.
The original Current Cost devices do not do a very good job of providing valuable information due to (in my opinion) quite poor software! Gordon has done a magnificent job of writing his own VB software to address that issue. After completing the software for the Classic, he has been recently working on the newer model (which requires a lot more programming due to the different data streams and the extra channels) He received a pre-release version of the 128 from the importer to allow this development. In summary I find Gordon's achievments to be amazing!
As you can see from Gordon's screen dump, the graph displays information that would otherwise be un-available. In my case I use it to monitor three channels. They are Solar1 array output, Solar2 array plus wind output, and Total household consumption. By regularly checking the graphs, I have made very significant changes to my system to allow better energy efficiency. I believe that this has allowed me to pay for the cost of the Current Cost in about 6 months due to energy cost reductions.
Some of the changes made as a result of the monitoring are:
- a faulty capacitor in a rain water pump was causing the pump to intermittently not start. Instead it sat in a stalled state until the thermal cut-out activated. This caused massive power consumption that was seen by huge peaks in the household graph. I would not have detected this without the CC.
- my solar grid connect inverter consumes excessive power during start-up. This is seen clearly on the graph but would not be detected by any other normal means.
- a faulty electronic battery charger was consuming large amounts of power.
- my home network of computers often wake up during the middle of the night without apparent reason. The consumption graph clearly shows at what time this happened, and allows for fault finding.
- my media centre computer consumes excessive power. This can be seen by the jump in consumption when it turns on. I was previously totally unaware how much power this was consuming. Now I am replacing the mobo with a low power Atom board.
- the CC clearly demonstrated that I had a very high background power consumption around 350 watts (this was the base 24/7) I have now reduced this by buying some cheap electronic power time clocks to inactivate un-necessary devices for part of the day
- I am able to relate wind generated power to wind speeds and use this information to increase turbine efficiency by experimenting with blades, controller etc.
- etc etc etc. It is amazing what can be interpreted from the graphs
Bolty |
| |
Bree
Newbie
Joined: 11/12/2009
Location: AustraliaPosts: 6 |
| Posted: 05:03am 19 Dec 2009 |
Copy link to clipboard |
Print this post |
|
Thanks Bolty for the info, i think ill be getting one, got lots of new toys to play with over the xmas break, well when i finish work in late January for my holidays
Bree
you only get one go at it ! |
| |
