Guru
Joined: 05/03/2018
Location: NetherlandsPosts: 5030
| Posted: 02:28pm 01 Mar 2022 |
Hi Peter,
Please check the MATH FFT function. For CMM2 we had to fix it, and for MMB4W we seem to run into a similar issue (although not identical).
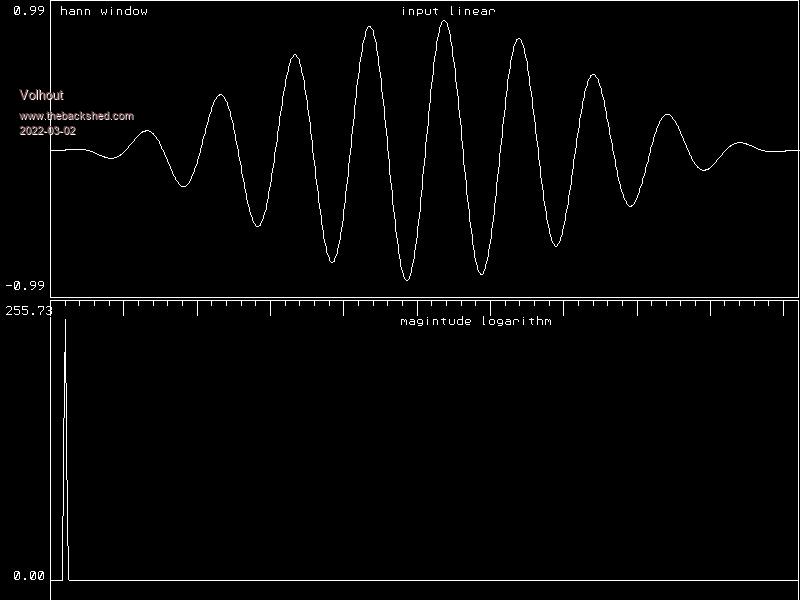
When I take the FFT magnitude from a sinesquare windowed sine wave, and display it in linear scale, it should look like this (CMM2 fft calculation from below program):
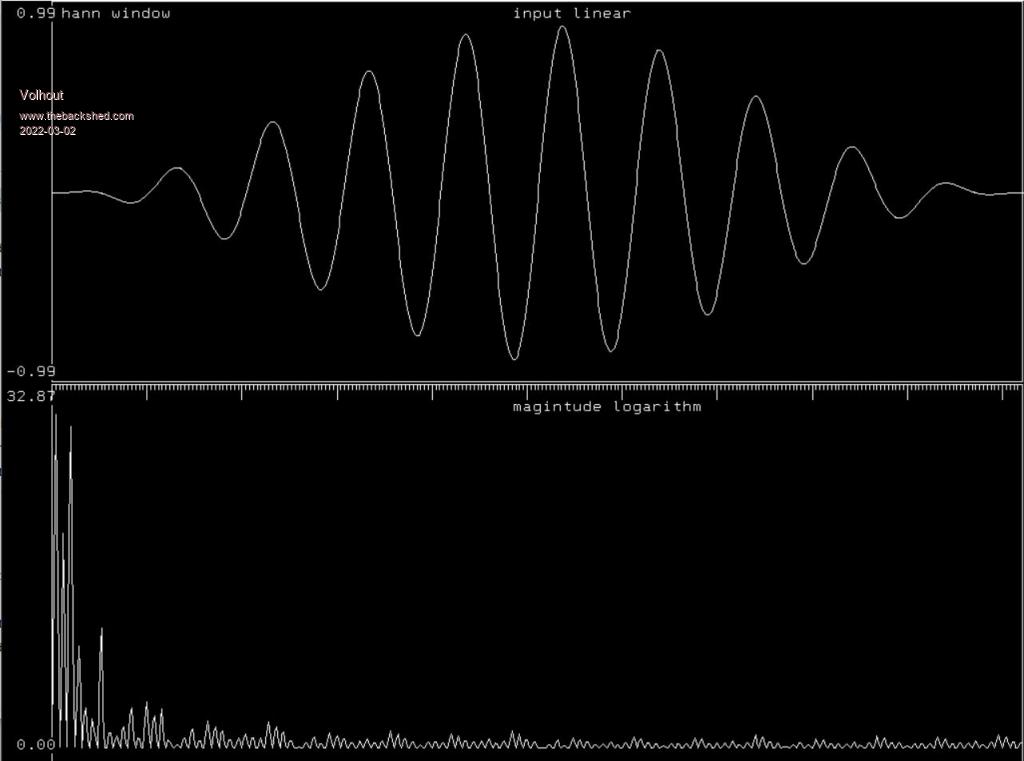
However, the MMB4W math function shows many spurious peaks. Below graph shows the sinesquare windowed sine signal (top), as well as the fft (lower graph)
I use this code to check it (the program can change the windowing function with "w", and change the number of sinewaves for fft with "a" and "z", and save the graph to disk with "s").
'check fft magnitude function
n=1023 'samples
cy=10 'cycles
sq=0 'sq=1 = square wave. sq=0 = sine wave
dim a!(n),fm!(n)
w=0 'window type, 0=none
do
cls
'draw 2 frames using mm.hres mm.vres
box 50,0,(mm.hres-51),mm.vres/2-2
box 50,mm.vres/2,mm.hres-51,mm.vres-1
'prepare input signal
sinfill
if k$="w" then w=(w+1) mod 4
if w then window
'plot input signal
plot_in
'do fft
math fft magnitude a!(),fm!()
'convert to logaritm
'lin2log
'plot fft
plot_fft
'keyboard commands
do
k$=inkey$
loop until k$<>""
if k$="a" then cy=cy+1
if k$="z" then cy=cy-1:cy=max(cy,2)
if k$="s" then save image "fft",0,0,800,600
loop until k$="q"
end
'subroutines
'fill the input array a!() with cy cycles of sinewave
sub sinfill
for i=0 to n
a!(i)=sin(2*pi*cy*i/n)
if sq=1 then
if a!(i)>0 then
a!(i)=1
else
a!(i)=-1
end if
end if
next i
end sub
'apply a window over the input signal (triangle for now)
sub window
if w=1 then
for i=0 to n/2 'linear
a!(i)=(i/n)*a!(i)
a!(n-i)=(i/n)*a!(n-i)
next i
? @(60,5) "triangle window"
else if w=2 then
for i=0 to n 'quadratic (do linear twice)
a!(i)=(i/n)*a!(i)
a!(n-i)=(i/n)*a!(n-i)
next i
? @(60,5) "quadratic window"
else if w=3 then
for i=0 to n 'sine^2 (hann) window
a!(i)=sin(pi*i/n)*sin(pi*i/n)*a!(i)
next i
? @(60,5) "hann window"
end if
end sub
'plot the input signal in the upper window
sub plot_in
'find minimum and maximum
mi!=0:ma!=0
for i=0 to n
mi!=min(mi!,a!(i))
ma!=max(ma!,a!(i))
next i
'? mi!,ma!
'calculate gain and offset to fit it into the window
xgain=(mm.hres-50)/n
xoffs=50
ygain=-(mm.vres/2.3)/(ma!-mi!)
yoffs=mm.vres/4-ygain*(ma!+mi!)/2
'plot the actual samples using linear interpolation
for i=0 to n-1
line i*xgain+xoffs,a!(i)*ygain+yoffs,(i+1)*xgain+xoffs,a!(i+1)*ygain+yoffs
next i
'add legend
? @(mm.hres/2,5) "input linear"
? @(5,5) str$(ma!,2,2)
? @(5,mm.vres/2-20) str$(mi!,2,2)
end sub
'plot the fft output in the lower window
sub plot_fft
'find min and max and where max is
mi!=1e6:ma!=-1e6
for i=0 to n/2 'fft output is symetrical
mi!=min(mi!,fm!(i))
ma!=max(ma!,fm!(i))
if ma!=fm!(i) then cf=i':? cf
next i
'apply some logaritmic scaling
'mi!=-120:ma!=60
'mi!=0:ma!=200
'mi!=max(mi!,-140):ma!=min(ma!,120)
'for i=0 to n
' fm!(i)=min(ma!,max(mi!,fm!(i)))
'next i
'calculate scaling to fit the window
xgain=2*(mm.hres-50)/n
xoffs=50
ygain=-(mm.vres/2.3)/(ma!-mi!)
yoffs=mm.vres-mi!*ygain-20
'plot the fft graph
for i=0 to n/2-2
line i*xgain+xoffs,fm!(i)*ygain+yoffs,(i+1)*xgain+xoffs,fm!(i+1)*ygain+yoffs
next i
'add legend
? @(mm.hres/2,mm.vres/2+15) "magintude logarithm"
? @(5,mm.vres/2+5) str$(ma!,2,2)
? @(5,mm.vres-30) str$(mi!,2,2);
'put marker ticks in multiples of centre frequency
for i=0 to n/2-2 step cf
line i*xgain+xoffs,mm.vres/2,i*xgain+xoffs,mm.vres/2+5
if ((i mod(5*cy)) = 0) then
line i*xgain+xoffs,mm.vres/2,i*xgain+xoffs,mm.vres/2+15
end if
next i
end sub
'convert linear output to logarithmic
sub lin2log
for i=0 to n/2
fm!(i)= 20*log(fm!(i)+1e-300)/log(10)
next i
end sub
Edited 2022-03-02 17:27 by Volhout