Guru
Joined: 02/02/2017
Location: AustraliaPosts: 1432
| Posted: 04:19am 15 Apr 2018 |
Part 20: where the wobbles come from
I am continuing in my investigation of causes of AC output waveform distortion.
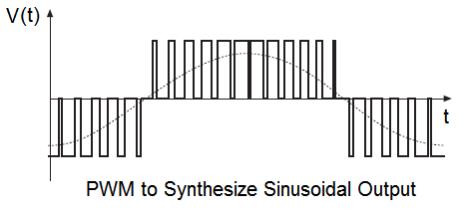
I assume we all have a clear understanding of PWM synthesis of a sine curve.
Skip all this if you know all about synthesis of the waveform, else read on if interested.
It's important to note that the sine wave is continuous, that is, it has a value
at any and all points in time.
PWM, or the duty cycle of the PWM has discrete values at any and all points in time.
It's ON or OFF.
No PWM duty cycle implies zero duty cycle (i.e approximating a zero level of a waveform)
but it can also represent an absent waveform or signal too.
There is no way to produce a continuous waveform via PWM (except in the special case of
DC which is not important to this discussion). We can produce a waveform that
is progressively more accurately approximating the continuous curve as we
increase the PWM frequency. This is akin to increasing the sample rate of a sampled continuous
signal.
In the case of the EG8010 based inverter the PWM frequency is 23.4 kHz.
My Arduino prototype produces a 20kHz PWM output. I can also make it produce
any other frequency such as 10kHz or 40kHz PWM sine wave modulated output.
Different PWM frequencies was one of the reasons why I built the prototype.
These inverters we are building and playing with use PWM to approximate a continuous sine wave.
The deficiencies of the PWM approximation are smoothed over by the filtering of the PWM
output as it is fed into the transformer.
The filter we use is a LC type low pass filter. The L part is the 45uH (or whatever) inductor and the
C part is the mains voltage capacitor across the 240V AC output.
This filter arrangement passes low frequencies through with very little resistance
and progressively reduces high frequency’s power.
where Low frequencies such as 50Hz.
and High frequencies such as > 100 Hz
We design the filter to efficiently pass the 50Hz output.
No filter is perfect and so this simple LC filter lets through some amounts
of the various higher frequencies.
Finally I want to bring up the frequency components of a waveform.
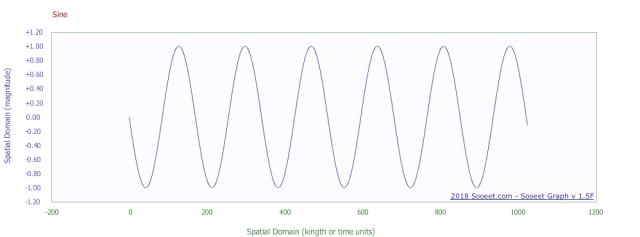
A sine wave without very much of any other frequencies will have a power spectrum
of a single high value at one frequency and low values of power at all the others.
sine wave
fft (or graph of power v/s frequency) of sine wave
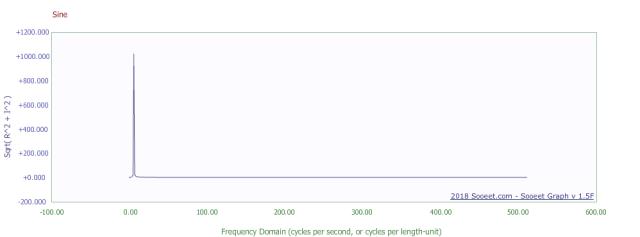
See the peak of about 1000 at the location on the X axis = 1? That is showing that
all the power of the sine wave is contained in one frequency.
A pulse waveform is a very different fish indeed.
pulse
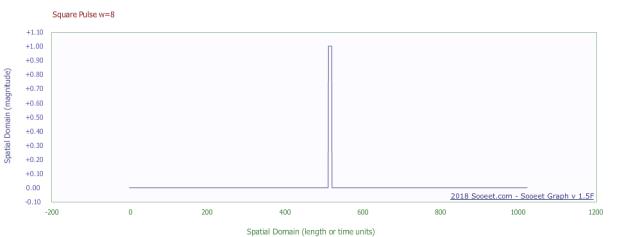
fft of pulse
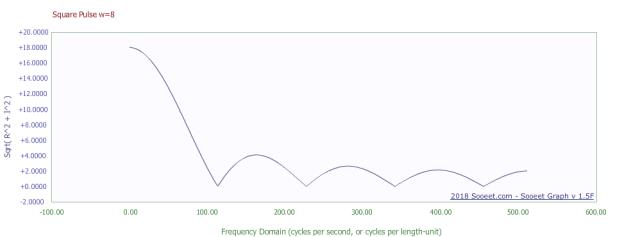
See that there are a lot of frequencies that carry significant power levels in this pulse waveform.
PWM is nothing more than a sequence of pulses.
The high frequencies are the result of the fast changes in the signal.
We are generating signals with large amounts of high frequency power within the PWM output
of the inverter’s power bridge. The PWM is to all intents and purposes a square wave with fast edges (the rise and fall of the square wave). We are pumping into the transformer primary
a huge amount of high frequency power.
Here in this forum we have seen various people’s inverter AC waveforms, containing various
wobbles.
here
These wobbles are in my view caused by the PWM’s imperfect approximation to a
continuous sine wave and the filter. The degree of wobble and the frequencies found within the wobbles are related to the LC filter’s frequency attenuation characteristics.
I show a simple experiment, what happens to the AC output waveform when you
purposely introduce more high frequency power. In this experiment no changes were made to
anything other than modifying the PWM data in the following way:
Blue is unchanged sine wave
Red is the modified sine wave similar to what I used below…
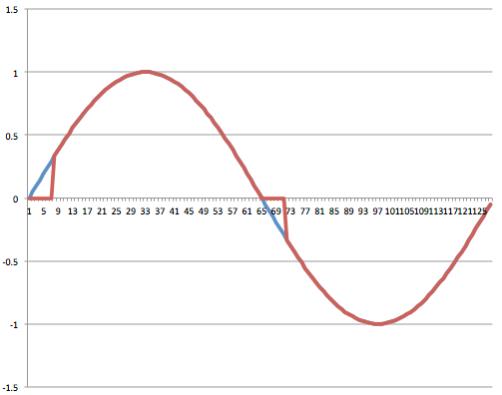
I zeroed the first 10 of 200 values of the sine wave PWM lookup table in the Arduino code. This effectively adds a fast change to the PWM
approximated sine wave, thereby adding some more HF power.
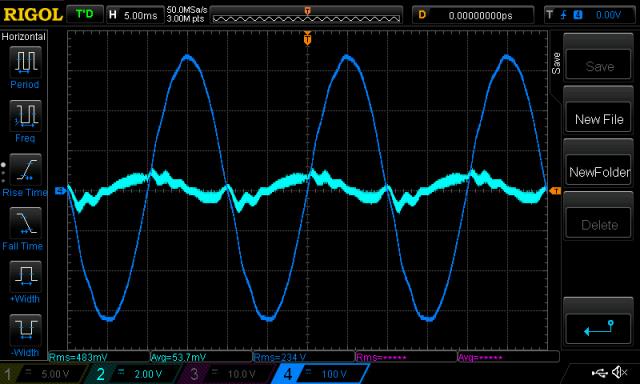
dark blue is AC output
light blue is primary winding current.
unaltered PWM
zeroed 10 of 200
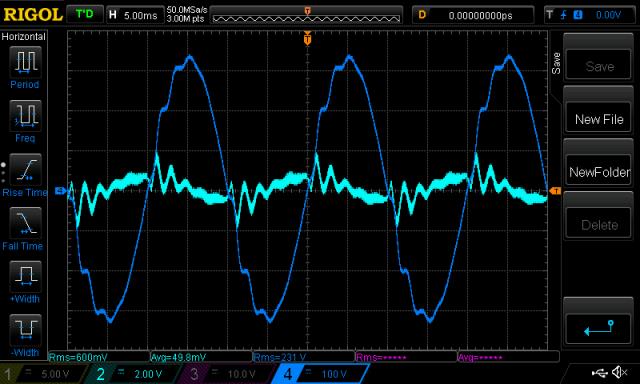
Clearly these wobbles in the AC output are due to incomplete removal of high frequency power
which is generated by PWM sine wave synthesis.
It looks like I added a fair bit of power at about 1/2ms or 500Hz by adulterating
the PWM lookup data.
Notice that in each of our inverter AC output traces, the wobbles begin after
the AC output passes through zero? This is when the PWM is zero and the first short pulse (approximating a small value of the sine wave and so it MUST BE SHORT) happens
about 50 us afterwards. We have seen (above) the power at various frequencies that is contained in a pulse signal.
wronger than a phone book full of wrong phone numbers