Notice. New forum software under development. It's going to miss a few functions and look a bit ugly for a while, but I'm working on it full time now as the old forum was too unstable. Couple days, all good. If you notice any issues, please contact me.
rgormley Senior Member Joined: 22/02/2006 Location: AustraliaPosts: 245
Posted: 05:45pm 26 Mar 2009
Copy link to clipboard
Print this post
Has any one got some real logged data (in melbourne)
of the amount of kw`s produced per day, say over the last month? on a 1 or 2kw solar setup
perhaps a dump of data from a fronius?
Cheers,
Richard
GWatPE Senior Member Joined: 01/09/2006 Location: AustraliaPosts: 2127
Posted: 07:11pm 26 Mar 2009
Copy link to clipboard
Print this post
Hi Richard,
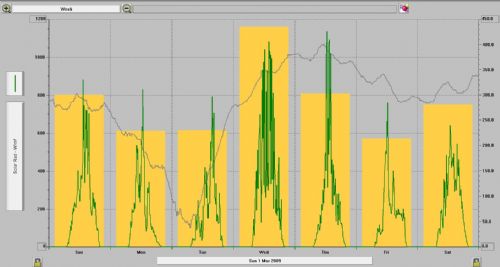
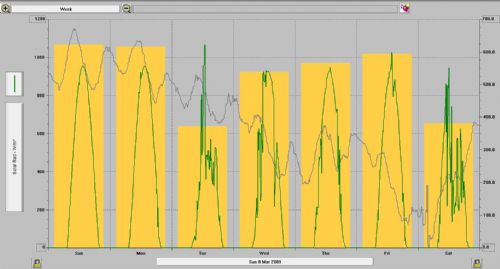
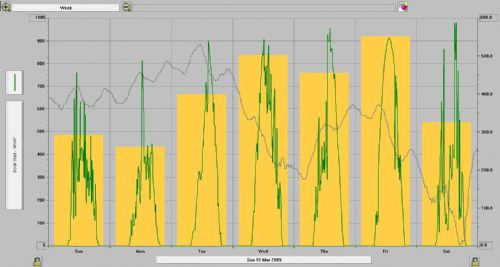
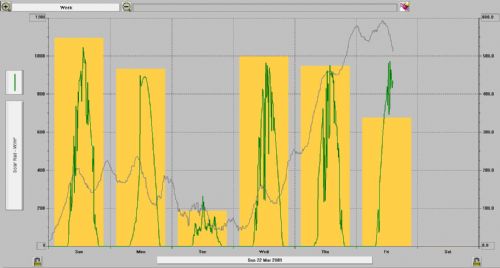
I have solar insolation levels logged from my Davis weather station. I am at latitude 35.5, on the South coast near Victor Harbor. I base my solar as more similar to Melbourne than Adelaide. I have plotted incident solar as W/m^2 and the daily solar energy as Ly. The green jagged trace is the incident solar and the yellow bar graph is the daily energy. The peaks above 1000 are from reflected light cloud effects.
There are 4 charts of a weeks data each.
I have found that the solar array output follows the solar energy closely, so I don't bother to record daily solar power output any more.
The BOM should have incident solar levels for Melbourne. You will need to integrate this data over a day and scale it to get the solar energy.
You will get the idea of the effect of clouds with output electricity produced.
Gordon.
PS edit: for example the solar power that my 2.4kW array produced on the 24/03/09 was 2.1kWhr. The lowest I have recorded was in 2006, with 0.1kWhr on one day.Edited by GWatPE 2009-03-28become more energy aware