
|
|
Forum Index : Microcontroller and PC projects : Digoo 433MHz Temp/RH plotting
| Author | Message | ||||
| paceman Guru Joined: 07/10/2011 Location: AustraliaPosts: 1329 |
Gents I've got a problem that I can't figure out here. I'm plotting two Digoo 433 MHz Temp/%RH sensors on a 2.8" ILI9341 (320x240) using @TassieJim's receiving method and @disco4now's here decoding method. Their part is working fine but some of mine isn't - surprise, surprise! The timescale (x) plotting position (variable 'xposn') is the problem. It's supposed to plot pixels across the screen for a bit over five hours (320 screen lines/minute) then clear the screen, re-write the grids and start plotting again. As you can see below, it doesn't. It starts fine for a couple of hours but then jumps back an hour, does another two hours and jumps back again etc. It does at least find the end of screen, re-draw the grids and start plotting again properly. I've included all the code below but as I see it,  the problem can only be in the last half of the 'plotdata' subroutine or the middle third of the 'drawgrids' routine with the TIMER command at the end. the problem can only be in the last half of the 'plotdata' subroutine or the middle third of the 'drawgrids' routine with the TIMER command at the end.The firmware is MMBASIC v5.04.05 (haven't updated for a while). There's another issue with the 'boxed' coloured data results. They should always have 1 dec. place for temperature and just two characters for %RH as transmitted. I think the TEXT commands for these are right (again in the 'drawgrids' subroutine) and for most of the time they do display correctly - the overwritten area seen above is there when I check it in the morning after an all night run. Any suggestions gratefully received. Greg 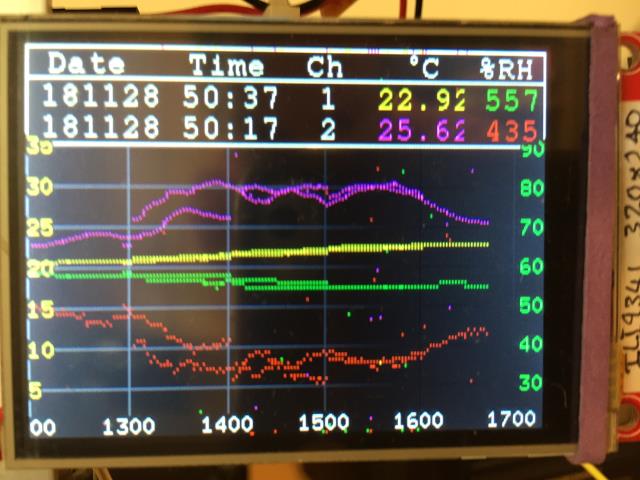 'Plots temperature and relative humidity from two Digoo 433MHz sensors. 'Uses Jim Hiley's technique to read the transmission and Gerry Alardice's to decode. 'Greg Yaxley - Nov. 2018 MMBasic Ver 5.04.05 '------------------------------------------------------------------- option autorun on Option Explicit Option Default NONE cls const blue=rgb(blue),green=rgb(green),yellow=rgb(yellow),red=rgb(red) const cyan=rgb(cyan),magenta=rgb(magenta),BRGRAY=rgb(150,150,150) dim tick%,tock%,code$,codeinv$ DIM dattime$,channel$,relhumid$,temp$,oldresult$ dim curdate$,curtime$,info$ dim as integer xposn,plotstart,basehour PWM 1,100000,50 'this is the high resol'n timer (PWM 1A from pin 4) connected to pin 16. SETPIN 16, CIN 'inout pin for the high resolution timer. SETPIN 21, INTL, blip 'input pin for the data out (DO) of the 433MHz receiver module. 'It triggers on a high or low transition. The pin used must be 5V tolerant. ' FONT #2 'A bigger font (12x20) for the 2.4" panel - library saved as Font #2 for the MM2. rtc gettime drawgrids '============================================== DO 'IF INKEY$<>"" THEN 'PRINT code$ 'ENDIF LOOP '============================================= SUB blip tock% = tick% tick% = PIN(16) select case tick%-tock% case > 800 if len(code$)=37 and left$(code$,1)="1" then 'valid data if mid$(code$,17,1)="0" then getdata '0 in bit 17 means a +ve temp. endif code$="" codeinv$="" case > 350 code$ = code$ + "1" codeinv$= codeinv$+"0" case > 150 code$ = code$ + "0" codeinv$= codeinv$+"1" case else code$="" codeinv$="" END select END SUB ================================================ sub getdata curdate$ = date$: curtime$ = time$ dattime$ = right$(curdate$,2)+mid$(curdate$,4,2)+left$(curdate$,2)+" "+Right$(curtime$,5) channel$ = STR$(VAL("&B"+mid$(code$,15,2))+1) '? channel$ temp$ = STR$(VAL("&B"+mid$(code$,17,12))/10,2,1) 'rec'd temp is 0.1x10 so needs /10. relhumid$ = STR$(VAL("&B"+mid$(code$,30,7))) 'rec'd %RH is whole numbers. info$ = dattime$ +" "+ channel$ +" "+ temp$ +" "+ relhumid$ if info$ = oldresult$ then exit sub 'removes the 'triple' transmission. oldresult$ = info$ 'holds current result for above comparison. plotdata 'valid data so plot it. end sub '--------------------------------------------------- sub drawgrids cls local integer j,k,p,q,gridtop,basehour FONT #2 'A bigger font (12x20) for the 2.4" panel - library saved as Font #2 for the MM2. text 0,0," Date Time Ch `C %RH",,2 gridtop = 3*mm.fontheight 'gridtop = top of y scales. Allows 3 rows of Font #2. box 0,0,mm.hres,20: box 0,0,mm.hres,gridtop 'boxes for heading & current data font #1 'Vertical Grid (X axis Timescale) basehour = val(left$(time$,2)+"00") 'start for X grid time-scale in 24hr format. for k=0 to mm.hres step 60 '60 mins/gridline --> ~1/line spacing per result. line k,gridtop,k,mm.vres,,BRGRAY 'vertical grid lines text k,mm.vres,str$(basehour,4,0,"0"),CB '1-hour grid increments in 24-hour format. basehour = basehour+100 'gives the 1-hour scale. if basehour = 2400 then basehour =0 'test for midnight next k 'Horizontal Grid (Y axis Temperature & Rel.Humidity) restore 'initialise grid scale DATA in case of previous READs data 35,90,30,80,25,70,20,60,15,50,10,40,5,30 'oC/%RH pairs for y scales on 2.8" screen. for j=60 to mm.vres-10 step 25 '25lines=5oC 0.2oC/line & 25lines=10%RH 2.5lines/%RH read p,q 'oC & %RH - 7 pairs stops timescale overwrite. line 0,j,mm.hres,j,,BRGRAY 'horiz. grid lines, brighter gray than normal text 0,j,str$(p),LM,,,yellow 'oC at left text mm.hres,j,str$(q),RM,,,green '%RH at right next j timer=0 'zeroes the elapsed-time base for data plot pos'n. in 'plotdata' subroutine. end sub '---------------------------------------------------- sub plotdata local integer plotstart,xposn if channel$ ="1" then text 8,20,dattime$ +" "+ channel$,,2 text 200,20," "+temp$,,2,,yellow 'table data for channel 1. text 268,20," "+relhumid$,,2,,green else text 8,39,dattime$ +" "+ channel$,,2 text 200,39," "+temp$,,2,,MAGENTA 'table data for channel 2. text 268,39," "+relhumid$,,2,,red endif plotstart = val(mid$(curtime$,4,2)) 'for X timescale; mins since grid zero time. xposn = plotstart + (timer/60000) 'the above + elapsed mins since then if xposn => mm.hres then 'if at end of screen drawgrids xposn = plotstart 're-draw grid, sync plot-time in 1st hr at left. endif if channel$ = "1" then pixel xposn,235-5*val(temp$),yellow 'intercept & slope of temp scale pixel xposn,285-2.5*val(relhumid$),green 'same for %RH else pixel xposn,235-5*val(temp$),magenta 'intercept & slope of temp scale pixel xposn,285-2.5*val(relhumid$),red 'same for %RH endif end sub |
||||
Chopperp Guru Joined: 03/01/2018 Location: AustraliaPosts: 1123 |
Nice display (apart from your problems) Question. What does this bit do? Main loop? DO 'IF INKEY$<>"" THEN 'PRINT code$ 'ENDIF loop Edit. Read original code. Is main loop ChopperP |
||||
| paceman Guru Joined: 07/10/2011 Location: AustraliaPosts: 1329 |
Err.. small edit to my post above, last paragraph. The TEXT commands mentioned are in the 'plotdata' subroutine, not in 'drawgrids' as I had. Greg Another thing I didn't mention. The Digoo sensors transmit a new result about every 50 seconds so there are typically a set of two plotted pixels for each channel (four colours) for each vertical screen line which represents one minute since the grid lines are 60 lines (mins) spaced. |
||||
| erbp Senior Member Joined: 03/05/2016 Location: AustraliaPosts: 195 |
One problem that I can immediately see is in setting the dattime$ variable in getdata sub: sub getdata curdate$ = date$: curtime$ = time$ dattime$ = right$(curdate$,2)+mid$(curdate$,4,2)+left$(curdate$,2)+" "+Right$(curtime$,5) The current code as shown above takes the MM:SS portion of Time$, dropping the HH: portion. I think you want the HH:MM portion dropping the :SS bit, in which case you need to use +Left$(curtime$,5) instead of +Right$(curtime$,5). I'm not sure if this is the cause of all your other problems, but I think it could well be. Cheers, Phil. |
||||
| paceman Guru Joined: 07/10/2011 Location: AustraliaPosts: 1329 |
Hi Phil - thanks for looking. I deliberately take the MM:SS data into 'dattime$' and hence into 'info$' along with the temp/RH and channel so that any 'new' data is picked up but the triple auto transmission from the Digoo's is removed. Down in the 'plotdata' routine here; plotstart = val(mid$(curtime$,4,2)) 'for X timescale; mins since grid zero time. xposn = plotstart + (timer/60000) 'the above + elapsed mins since then the plotting position (xposn) is extracted as the MM data from the held 'curtime$', not from 'dattime$' and then added to the elapsed time since re=drawing the grid. The text box time info; if channel$ ="1" then text 8,20,dattime$ +" "+ channel$,,2 text 200,20," "+temp$,,2,,yellow 'table data for channel 1. text 268,20," "+relhumid$,,2,,green else does come from 'dattime' but that's deliberate so I can see new data coming in with MM:SS displayed, because often the temp and %RH don't change. When I get this going properly I will change that text box time back to HH:MM, which is a lot more appropriate. Greg |
||||
| erbp Senior Member Joined: 03/05/2016 Location: AustraliaPosts: 195 |
Ah, I was going by the fact that the screen image showed the time as "50:37" and "50:17" - I didn't realise that was deliberate - sorry. Phil. |
||||
| The Back Shed's forum code is written, and hosted, in Australia. | © JAQ Software 2026 |
