
|
|
Forum Index : Microcontroller and PC projects : A Debugger for MMBasic DOS
| Author | Message | ||||
| lizby Guru Joined: 17/05/2016 Location: United StatesPosts: 3784 |
Here is a description of version 0.1 of a debugger for MMBasic DOS. The changes to Geoff's code were very minimal--I added TRACE DBG to the TRACE command, added a flag (“int TraceDbg;” in Commands.c) to indicate that it had been encountered, and turned the flag off with TRACE ON and TRACE OFF. The cmd_trace code in Commands.c then consists of this: void cmd_trace(void) { if(checkstring(cmdline, "ON")) TraceOn = true; else if(checkstring(cmdline, "OFF")) { TraceOn = false; TraceDbg = false; } // LB else if(checkstring(cmdline, "DBG")) { TraceOn = true; TraceDbg = true; } // LB #if !defined(MX170) In MMBasic.h I added “extern int TraceDbg;”. In MMBasic.c I added “extern int mmb_dbg(int);” and the “if (TraceDbg)” line in the following code. if(TraceOn && p < ProgMemory + Option.ProgFlashSize) { if (TraceDbg) { if (mmb_dbg(CountLines(p))==0) longjmp(mark, 1); } // call debugger; break on zero return code else { inpbuf[0] = '['; IntToStr(inpbuf + 1, CountLines(p), 10); strcat(inpbuf, "]"); MMPrintString(inpbuf); uSec(1000); } } And that’s it. When MMBasic encounters “TRACE DBG” it sets a flag and calls the debugger function, mm_dbg, with the line number with every line (instead of printing the line number after TRACE ON). If it encounters TRACE ON or TRACE OFF, it stops calling the function. Mmb_dbg itself sends its output over serial to a VT100 terminal at a rate of 115200 (for instance, to TeraTerm on another PC). Here’s what the window looks like: 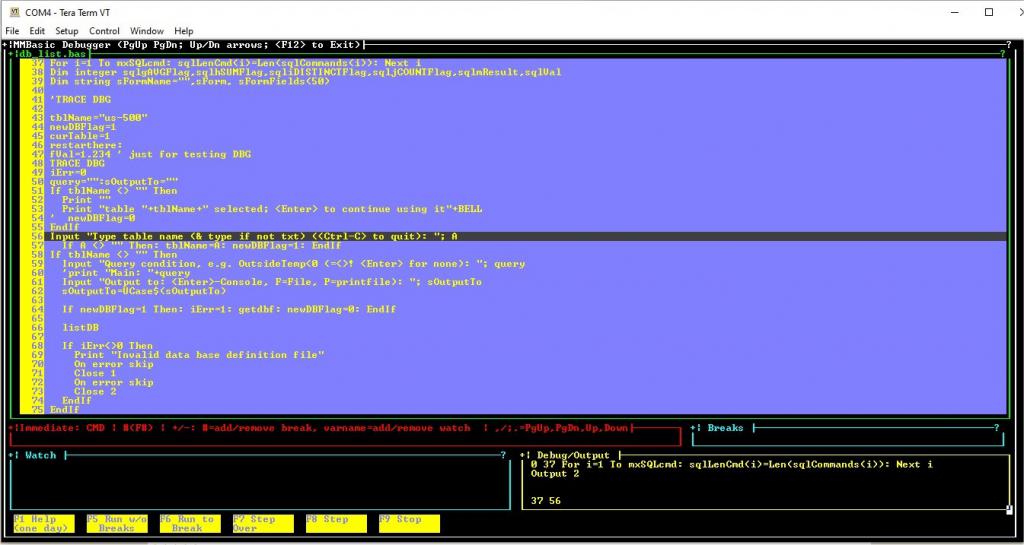 Functionality is rudimentary at present. The program reads the .BAS program from disk (doesn’t reconstruct it from MMBASIC memory), and displays a window, starting just above the “TRACE DBG” line. The current line is indicated with a grey background. You can scroll forward and backward with “/” and “,” (I haven’t yet figured out how to use the function keys). You can add breakpoints to lines with “+62” (for instance). Multiple breaks are supported. I’m not certain of the cleanest way to handle input. At present, you have to watch the program code window to see if it is prompting you for input. If it isn’t, input will go to the debugger. At present, in addition to scrolling, you can enter “1” to single-step, “2” to run at speed to a breakpoint (or end of program), or “3” to run to a breakpoint while highlighting every line with a .3 second pause before moving to the next line. I’ve run through a thousand-line program watching it spin through the tight loops and bounce around the various functions and subs. Input of "0" breaks to the ">" prompt. Then you can quit, edit the basic program on the PC (I use notepad++), and rerun. This provides pretty quick turnaround and saved my having to write or incorporate an editor. I plan to add watches for variables, and perhaps to break on variable=something. I have not fully comprehended Geoff’s “level” structure for distinguishing global from local variables of the same name, so I might be able initially only to watch global and top-level or unique variables. I plan to add an “immediate” print command with ?varname, just as if you were at the “>” prompt. It might be possible to expand that to allow simple assignments or even more complex commands, like EVAL does on the CMM2. Ah, the CMM2. I have not looked at the code, and I’m not sure how useful this type of debugger would be for the development of graphics programs. However, aside from the fact that the vartable is different and perhaps other structures are different, since the only modification to MMBasic is the TRACE DBG addition, I don’t know why it couldn’t be made to work. This has been a fun little task for me. I haven’t written any serious C code in over 20 years. I had to look up everything, and made all the rookie mistakes—“=“ for “==”, “a” for ‘a’, comments beginning with single quote, “endif”s in “if” structures. It went better than I feared it would. Thanks to "flip" for his TUI scheme . Anyway, tl;dr, but I’ll continue this thread as the code progresses. Not posting yet. ~ Edited 2020-11-23 13:17 by lizby PicoMite, Armmite F4, SensorKits, MMBasic Hardware, Games, etc. on FOTS |
||||
| The Back Shed's forum code is written, and hosted, in Australia. | © JAQ Software 2026 |
