
|
|
Forum Index : Microcontroller and PC projects : Bosch Temperature Sensor
| Author | Message | ||||
jman Guru Joined: 12/06/2011 Location: New ZealandPosts: 711 |
Hi all I am adding a new Temperature sensor to my car. The sensor is a Bosch 0 280 130 026 NTC http://www.bosch-motorsport.com/pdf/sensors/temperature/NTC_ M12.pdf Before i reinvent the wheel .I was wondering if anybody had a method of reading this type of sensor. A 1K pullup resistor seems to be the recommended way Unfortunately this device is not linear as shown by the table So I think a lookup table would be the way to go Any help would be greatly appreciated T [�C] R [�] -40 45,313 -30 26,114 -20 15,462 -10 9,397 0 5,896 10 3,792 20 2,500 30 1,707 40 1,175 50 834 60 596 70 436 80 323 90 243 100 187 110 144 120 113 130 89 Regards Jman |
||||
BobD Guru Joined: 07/12/2011 Location: AustraliaPosts: 935 |
jman, your link does not work. I get a 404. 404 - File or directory not found. |
||||
| jman Guru Joined: 12/06/2011 Location: New ZealandPosts: 711 |
Hi Bob Hmm copy paste must showing me up :) Try the new one Attatched Jman [2012-08-11_053804_NTC_M12.pdf /URL] |
||||
djuqa Guru Joined: 23/11/2011 Location: AustraliaPosts: 447 |
Yes an array with the data points would probably be the best option in MBasic. It has the typical non-linear curve of thermosensors. Corrected Direct Link for spec sheet [code] http://www.bosch-motorsport.com/en-US/literature/en-US/Tempe rature_Sensor_NTC_M12_Datasheet_51_en_2782569739.pdf [/code] VK4MU MicroController Units |
||||
| Bugs2 Newbie Joined: 18/05/2012 Location: United KingdomPosts: 29 |
Unless you specifically need to have a thermistor, why not use a linear output semiconductor temperature sensor. You would have a choice of analog or digital (I2C or SPI) output. For example, the type that I found very easy to use with long unscreened cables in an automotive environment was the Analog Devices AD590, which is a two pin current output device. This only requires a series resistor to ground to produce a voltage at an ADC input. |
||||
| jman Guru Joined: 12/06/2011 Location: New ZealandPosts: 711 |
Hi Yip I can do the other sensors But this one is a perfect fit to the block and gearbox. and i allready have a set of them :) Jman |
||||
| ajkw Senior Member Joined: 29/06/2011 Location: AustraliaPosts: 290 |
It is a log curve, there will be an equation that goes close. Perhaps this helps http://web.cecs.pdx.edu/~gerry/class/EAS199B/howto/thermisto rCalibration/thermistorResistanceCalibration.pdf Found with Google! Anthony. |
||||
| JohnS Guru Joined: 18/11/2011 Location: United KingdomPosts: 4337 |
In many cars you can just ask via OBD for the temp(s). John |
||||
bigmik Guru Joined: 20/06/2011 Location: AustraliaPosts: 2981 |
Hi Jman, Of course you could do this sort of approximation 4 cls 5 ' Assume Res= the resistance measured 6 input"Res ";res 10 if res < 5896 then goto 20 else print"0 deg or less" : goto 6 20 if res < 3792 then goto 30 else print"temp= ";10-((res-3792)/(5896-3792)*10): goto 6 30 if res < 2500 then goto 40 else print"temp= ";20-((res-2500)/(3792-2500)*10) : goto 6 40 if res < 1707 then goto 50 else print"temp= ";30-((res-1707)/(2500-1707)*10): goto 6 50 goto 6 This would assume a straight line between every group of 10 degrees and calculate an approximate... I have only done the figures from 0-30 deg you can do the rest if this works for you.. My sample just asks for the value of the Resistance (Res) and displays an approximate.. And seeing the accuracy is not great (1.4deg at 25c and 3.4deg at 100c) I reckon the approximation isnt bad (it will be at its worst at the mid point (5deg) mark. regards, Mick Mick's uMite Stuff can be found >>> HERE (Kindly hosted by Dontronics) <<< |
||||
TassyJim Guru Joined: 07/08/2011 Location: AustraliaPosts: 6541 |
The first step is to convert the resistance values into voltages. With a 1k resistor from 3.3V to the sensor and the other side of the sensor to ground, the table is: T R V -40 45313 3.228745709 -30 26114 3.178291657 -20 15462 3.099538331 -10 9397 2.98260075 0 5896 2.821461717 10 3792 2.611352254 20 2500 2.357142857 30 1707 2.080938308 40 1175 1.782758621 50 834 1.500654308 60 596 1.232330827 70 436 1.001949861 80 323 0.805668934 90 243 0.645132743 100 187 0.519882056 110 144 0.415384615 120 113 0.335040431 130 89 0.26969697 I then put this into a chart in Excel and get a trendline. A third order polynomial gives a close match: 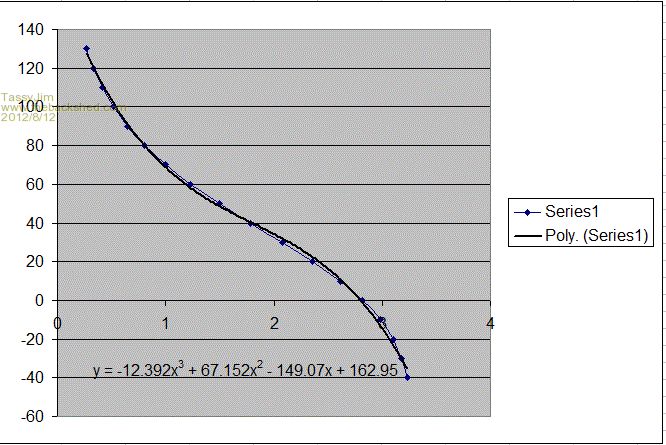
The formula is on the chart. This is usually close enough given the likely accuracy of the sensor and the MMbasic 10bit ADC. For automotive use, I would put some protection between the sensor and the Maximite. There are a lot of nasties floating around under the bonnet. Jim VK7JH MMedit |
||||
| bigmik Guru Joined: 20/06/2011 Location: AustraliaPosts: 2981 |
Hi Jim, Good job there.. I wish I knew how to get excell to do those equations and plots (No I dont I will only get myself into trouble) The statement I made earlier is a bit ambiguous.. the accuracy is of the sensor itself (and not my approximation) and is quite a bit especially at the higher end of the range...My approximation I believe would fit the bill quite well... of course it needed a calculation of resistance (with pullup) to voltage.. I was showing a theory... Goes to show there are many ways to skin a cat. I would use a duinomite as the `mite hardware due to the `industrial' design of the power supply and you should protect the analog input as well I would use a 3.6v Zener (1w) and a small ceramic cap to gnd at least but I am no expert in these things. Regards, Mick Mick's uMite Stuff can be found >>> HERE (Kindly hosted by Dontronics) <<< |
||||
| jman Guru Joined: 12/06/2011 Location: New ZealandPosts: 711 |
Many thanks for the reply's I have been using an orginal Maximite in the car for a few months now with no issues at all. With a small switchmode PSU for the 5V regulator @Mick I tried you method and it works just fine. I used ohms law to get the resistance from the measured volt drop across the 1k resistor. @Jim Your table is great and after a little fiddling with Excel i came up with this Temperature = (-12.392 * (engtemp^3))+(67.152*(engtemp^2))-(149.07*engtemp) + 162.95 This seem to work pretty well. once again thanks for the help Jman |
||||
| paceman Guru Joined: 07/10/2011 Location: AustraliaPosts: 1329 |
Mick, it's pretty straightforward getting EXCEL to do a chart and put a trendline and equation in it. Mind you, I had to do it a lot when I was a worker  so maybe that's easy for me to say! so maybe that's easy for me to say!
Here's how: 1.Launch EXCEL and put your data into two columns. 2.Put a heading at the top of each column - they'll become the axis headings later. 3.Select the headings and data by left clicking and holding from top left to bottom right of everything you put in, (it'll then be highlighted in blue.) 4.Click on "Insert" up in the toolbar area and select "Chart" in the drop-down box. 5.EXCEL will then automatically place a "Chart" (i.e.graph) on that page of your spreadsheet with your data. You can move it around by clicking in the chart area and moving it when the chart is "tagged". 6.Follow the instructions - the first question is to decide on your type of plot. It'll normally be an X-Y "scatter" plot for our purposes. Click on that and the plain "points only" sub-plot type and it'll display the chart. (Click on the others for fun?? and see what they do - click back on the scatter one when you're ready.) 7.You can change anything, grids, headings, scales etc, either while you're working through the "instructions" or later by right clicking inside the chart area. 8.Click through the rest of the instructions till you "finish" - the graph is then displayed with the points highlighted. 9.To get the calibration equation you need a "Trendline" as they call it. Right click right on top of any point and you should get a dropdown box. 10.Click on "Trendline" in the dropdown box and it'll display the different types of fit you can choose. For us it'll usually be linear, 2nd or 3rd order polynomial or log. Going to a higher order polynomial than third can sometimes give a better fit but the graph might also "turn back" on itself so check what happens to the full range of your input data if you do. 11.Click OK and the trend line is displayed on the graph. To get the equation displayed, right click with the cursor arrow on the trendline and choose "format trendline". 11.The box that comes up will then have an "Options" tab - click that and then click the "display equation on chart" option. OK out and you're there! NOTE: a)A common "gotcha" is to have the X & Y axes back to front. Swap them around if necessary and do it again. b)Most things can be changed, deleted, added etc by right-clicking on them in the chart area. That all looks not-so-simple but give it a go, it's pretty intuitive once you have the hang of it. Greg |
||||
| The Back Shed's forum code is written, and hosted, in Australia. | © JAQ Software 2026 |
