
|
|
Forum Index : Microcontroller and PC projects : Charts on the LCDs
| Author | Message | ||||
TassyJim Guru Joined: 07/08/2011 Location: AustraliaPosts: 6538 |
This is going to end up as part of my house monitoring system. It uses the MX170, ILI9341 and DHT22 all tied together with a BP170 from Mick. It will eventually have a lot more channels to display but for now there is inside temperature and humidity. The top section is the clock which will disappear when I need the space. Tapping the clock area changes the brightness - right for bright, left for dim. The lower section is for temperature and humidity. Tapping on Temperature will change the display to a graph of the last 24 hours. Tapping again returns the display to current readings. The same goes when you tap on the humidity. The readings are taken every 30 seconds and the maximum and minimums are stored in an array every 6 minutes which requires a size of 4 x 240 240 is a good size for the graph when the display is in landscape mode. I will use 10 minutes (144 readings per day) if I end up in portrait mode. 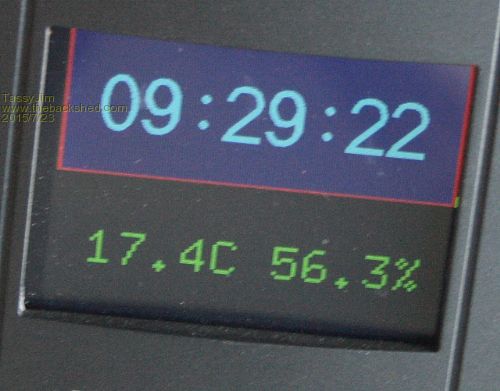
The display in "Current reading" mode. 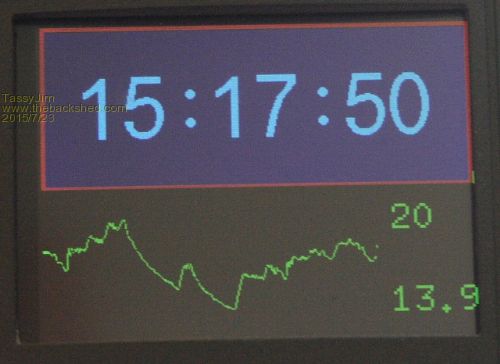
The display in "24hr" mode - numbers on right are max and min. ' OPTION LCDPANEL controller, orientation, D/C pin, reset pin [,CS pin]
' OPTION LCDPANEL ILI9341, RL, 4,5,6 ' OPTION TOUCH T_CS pin, T_IRQ pin ' OPTION TOUCH 7,2 ' GUI CALIBRATE OPTION EXPLICIT OPTION CLOCKTRIM -3 DIM in_temp, in_humid, tc, tcd, dograph, vmin, vmax, current$, d DIM readings(240,4) CONST DBlue = RGB(0, 0, 128) ' A dark blue colour SETPIN 26,DOUT ' display brightness PIN(26)=1 COLOUR RGB(GREEN), RGB(BLACK) FONT 2, 3 BOX 0, 0, MM.HRes-10, MM.VRes/2, 3, RGB(RED), DBlue SETTICK 30000, readall, 1 ' update readings every 30 seconds readall ' take an initial reading FOR tcd = 2 TO 240 ' initialise the reading array to the first reading value readings(tcd,1)=readings(1,1) readings(tcd,2)=readings(1,2) readings(tcd,3)=readings(1,3) readings(tcd,4)=readings(1,4) NEXT tcd tcd = 1 main: DO TEXT MM.HRes/2-5, MM.VRes/4, TIME$, CM, 1, 1, RGB(CYAN), DBlue IF TOUCH(X) <> -1 THEN tapped LOOP END SUB tapped LOCAL tx,ty, gx, gxv tx=TOUCH(X) ty=TOUCH(Y) BOX 0,210,239,39,1,RGB(black),RGB(black) IF ty < 120 AND ty >0 THEN ' tapped in the top section of the display so adjust brightness SELECT CASE tx CASE tx<50 PWM 2, STOP PIN(26)=0 CASE tx >200 PWM 2, STOP PIN(26)=1 CASE ELSE PWM 2, 100000, tx/2.8 END SELECT ELSE ' tapped on the temperature or humidity area dograph = 1 - dograph ' toggle text/graph display BOX 0,120,320,120,1,RGB(black),RGB(black) IF dograph = 1 THEN ' draw graph IF tx < 120 THEN ' tapped temperature side d=0 ELSE ' tapped humidity side d=2 ENDIF vmin=readings(1,d+1) '-1 vmax=readings(1,d+2) '+1 FOR gx = 1 TO 240 ' find minimum and maximum vmin=min(vmin,readings(gx,d+1)) vmax=max(vmax,readings(gx,d+2)) NEXT gx TEXT 250,130, STR$(vmax), TL, 2,2 ' print maximum TEXT 250,190, STR$(vmin),TL, 2,2 ' print minimum vmin = vmin-1 vmax = vmax +1 FOR gx = 1 TO 240 ' graph readings gxv=((gx+tcd) MOD 240)+1 LINE gx, vscale(readings(gxv,d+1)), gx, vscale(readings(gxv,d+2))+1 NEXT gx ELSE TEXT MM.HRes/2, MM.VRes*3/4, current$, CM END IF END IF PAUSE 100 END SUB SUB readall DHT22 15, in_temp, in_humid ' DHT22 connected to pin 15 PAUSE 2000 ' discard the first reading and take a second DHT22 15, in_temp, in_humid IF dograph = 0 THEN ' update the text display current$=STR$(in_temp)+"C "+STR$(in_humid)+"%" BOX 0,120,320,120,1,RGB(black),RGB(black) TEXT MM.HRes/2, MM.VRes*3/4, current$, CM END IF ' take a reading every 30 seconds and ' save the maximum and minimum every 12 readings (6 minutes) tc = tc + 1 IF tc = 1 THEN tcd=(tcd MOD 240)+1 readings(tcd,1)=in_temp readings(tcd,2)=in_temp readings(tcd,3)=in_humid readings(tcd,4)=in_humid ELSE readings(tcd,1)=min(in_temp,readings(tcd,1)) readings(tcd,2)=max(in_temp,readings(tcd,2)) readings(tcd,3)=min(in_humid,readings(tcd,3)) readings(tcd,4)=max(in_humid,readings(tcd,4)) END IF IF tc = 12 THEN ' 6 minutes up - reset counter tc = 0 END IF END SUB FUNCTION max(a,b) IF a>b THEN max=a ELSE max=b END IF END FUNCTION FUNCTION min(a,b) IF a<b THEN min=a ELSE min=b END IF END FUNCTION FUNCTION vscale(v) ' expand the graph to cover the actual reading range LOCAL vexpand vexpand=vmax-vmin vscale = INT(220 - ((v-vmin)*90/vexpand)) END FUNCTION Jim VK7JH MMedit |
||||
bigmik Guru Joined: 20/06/2011 Location: AustraliaPosts: 2981 |
Cool Jim, I will keep my eye on this as that is one project I have on my to do list. Regards, Mick Mick's uMite Stuff can be found >>> HERE (Kindly hosted by Dontronics) <<< |
||||
centrex Guru Joined: 13/11/2011 Location: AustraliaPosts: 320 |
Hi Tassyjim I like it, is the reason for using reverse landscape because that is the way you had the display mounted. I am going to try adding the BMP080 pressure sensor unless you have already done that. Regards Cliff Cliff |
||||
| TassyJim Guru Joined: 07/08/2011 Location: AustraliaPosts: 6538 |
Yes, I mounted the LCD in an old "rain meter" enclosure and that is the way it ended up. I will be doing similar displays mounted in light switch plates and they will be in portrait. To get the shorter graph, I will log every 10 minutes instead of 6. Eventually there will be inside and outside temp, pressure, rainfall and a lot more. There will have to be a number of "pages" to tap between. Jim VK7JH MMedit |
||||
| centrex Guru Joined: 13/11/2011 Location: AustraliaPosts: 320 |
Hi Jim What size is your LCD, running on my 2.8 created havoc until I changed the font sizes. The thing I have to work out is changing to portrait mode. It all works just waiting to see if the graph function does what it is supposed to do with min and max. Regards Cliff Cliff |
||||
| TassyJim Guru Joined: 07/08/2011 Location: AustraliaPosts: 6538 |
Display is 2.4" 320x240 I had to fiddle with the text size a bit with the changes between betas. Jim VK7JH MMedit |
||||
| centrex Guru Joined: 13/11/2011 Location: AustraliaPosts: 320 |
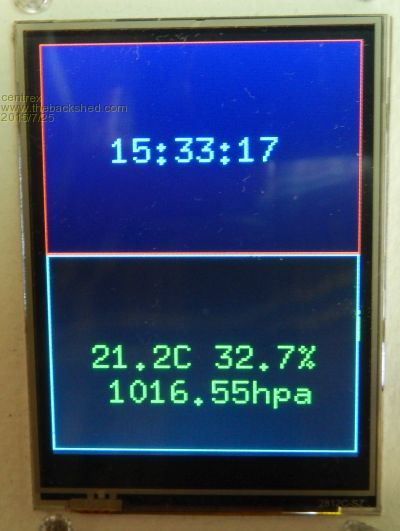
Here it is on a 2.8 TFT in portrait mode with the pressure havent got the averaging or the graph yet. I will have to do a lot of careful study of Tassy's code to get that to work. regards Cliff Cliff |
||||
| The Back Shed's forum code is written, and hosted, in Australia. | © JAQ Software 2026 |
