
|
|
Forum Index : Microcontroller and PC projects : WIFI, BINARY FILES AND XY GRAPH
| Author | Message | ||||
| CYBERLAB Newbie Joined: 08/08/2017 Location: MexicoPosts: 26 |
Hello everyone, first of all, sorry for my bad english. It's not my native language. I'm new using micromite, I have in mind an application where a binary file is sent via wifi to the micromite and every 3 bytes contain a Cartesian coordinate where the result can be -yo + yo -xo + x. where a user selects this file by means of a touch screen of 2.8 inches that in turn when reading the file will be graph in the screen being the center of said screen coordinates x0 and y0, I think I should use the modules esp8266 for wifi, xmodem for the transfer and save it in the cf card, and use the command LINE x1, y1, x2, y2 [, LW [, C]] to graph the file. I do not know much about programming, any help will be welcome and infinitely grateful. |
||||
| panky Guru Joined: 02/10/2012 Location: AustraliaPosts: 1120 |
Hi Cyberlab, welcome to the Backshed. You are taking on a very big task for a beginner programmer - perhaps you could break it down into some smaller bits as you learn the programming of the Micromite. I strongly recommend geoff's excellent 'Getting Started With The Micromite' which can be downloaded from here You might consider getting your graphing elements going first - you could simulate the data for the graph to use by setting a timer interrupt to periodically update the data for you to use, for example:- ' some initial variables to play with option explicit on dim x0 = 10 dim x1 = 20 dim y0 = 5 dim y1 = 15 ' graphing code here do 'code to extract of modify your test data ' code to display graph loop 'simulate code here to generate and update data for graph settick 2000,gen_data ' every 2 seconds, generate interrupt ' Every 2 seconds, the Settick timer will interrupt and call ' this simple subroutine to check global variables x0 and y0 - ' if they are less than their maximum values, it will increment ' them by 1, if greater, it will reset them to their initial values ' - it is just sample values - they could be set to anything you want sub gen_data if x0 > 20 then x0 = 10 else x0 = x0 +1 endif if y0 > 15 then y0 = 5 else y0 = y0 +1 endif end sub Once you have the data being graphed OK, you could then start on the ESP8266 link component of your program. So what I am suggesting is break your project up into little lumps and get each going correctly before you try to merge it all into your final program - much simpler to understand and also to debug. Also, I strongly recommend you comment your code as you generate it thus if you need to post some code on the forum that you are having trouble with, the forum members will have a better idea of what you are trying to do and it will be much easier to assist you. Good luck with your project. panky ... almost all of the Maximites, the MicromMites, the MM Extremes, the ArmMites, the PicoMite and loving it! |
||||
| CYBERLAB Newbie Joined: 08/08/2017 Location: MexicoPosts: 26 |
Hello Panky, first of all thank you for the tips on how to start my program in a modular way, as well as thank Geoffp, for this amazing minicomputer, as well as Grogster, Matherp and other collaborators. I started sending files to the micromite through teraterm using xmodem and saving them in the CF, and it was extremely easy !, the first 512 bytes of this type of files basically contain text, such as file name dimensions, max coordinates on axes -X, + X, -Y + Y from byte 513 to the end of the file contains coordinates in a kind of ternary code where every 3 bytes when decoding said code will have a numerical value in the range of 1 to 121 which equals to .1mm to 12.1mm of distance for X and another of equal form for Y, in such a way that by the size of our screen 240 x 320 I decided that 10mm = 1pixel. the graph will start at the center of the screen where the pixel of position Y120 and X160 will actually be Y0 and X0 as an example if decoding the first 3 bytes gives us as a result Y5 and X11 will plot a line starting at the pixel Y120 X160 (our origin Y0, X0) and ends in the pixel Y115 and X171 and if the next 3 bytes give us as a result -Y10 and -X4 will graph another line starting where the last line ends, ie in Y115 and X171 and end in Y125 and X167 and so on until the end of the file. my next goal is a subroutine that read every 3 bytes from the file and decode the size of the line in the lcd panel 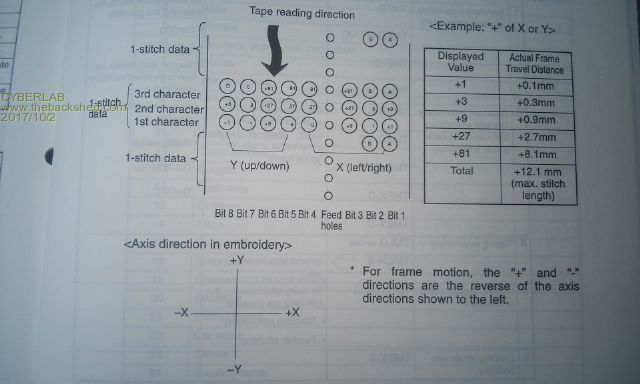 |
||||
| The Back Shed's forum code is written, and hosted, in Australia. | © JAQ Software 2026 |
