
|
|
Forum Index : Electronics : AC output analysis using what equipment you have
| Author | Message | ||||
| poida Guru Joined: 02/02/2017 Location: AustraliaPosts: 1432 |
I thought it time to describe how I can view the imperfections of the AC output of the inverter. In this post I will be looking at the harmonics in the output 50Hz sine wave using the mathematical tool called Fast Fourier Transform. The FFT is used to give us a graph of frequencies and their corresponding amount present. Frequency is along the X axis and the amount in the Y axis. The amount axis is in db, where 10 db is a factor of 3x, 20 db is a factor of 10x If you have a modern DSO, then you probably already have the FFT function my DSO shows this: 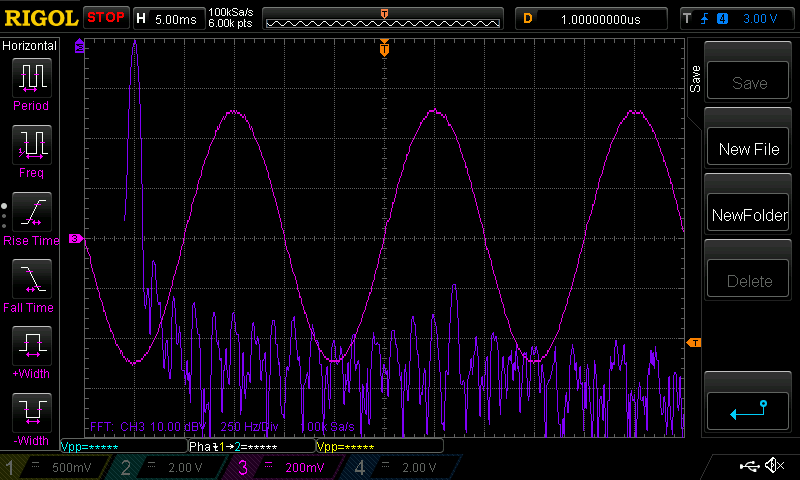 the FFT is the Purple trace, the waveform is the Pink one The 50Hz peak is the first peak you see, lined up at the top of the display, one horizontal division across. This is where nearly all of the voltage or power is contained, in the 50Hz part of the waveform. This is not surprising, we can see the nice 50Hz sinewave in the Pink trace. But there are some small deviations from a 50Hz sine.. These can be seen in the next and much smaller peaks. I found some nice and free (as in free beer) software that uses the PC sound card and can show very detailed FFT plots. The PC sound card seems to me to like an input up to 0.5V peak to peak but no more or else it will overload and show the harmonics due to the distortion of overloading. VASilviaBETA.zip Once I set up something to give me 0.5V peak to peak sample of the AC output I got this: 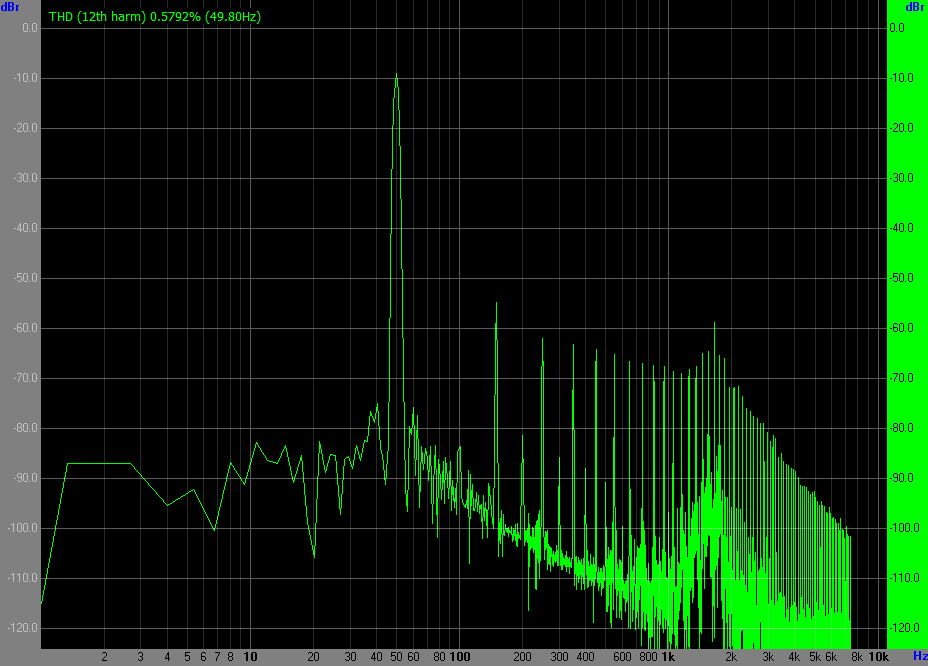 This is a lot better than the DSO due to far, far better signal to noise We get better S/N due to the 16 bit sampling resolution of the sound card (the DSO only has 8 bits) and there is something called "process gain" that comes from sampling the signal for relatively long time. This result benefits from both of these things. The noise level seems to be about -80db to -90db This corresponds to a voltage level of the noise of about (0.5 / 10,000) V p/p We can see the first harmonic is 150Hz at about -55db and when using this graph it's really clear and easy to see. The DSO can do it but it's no so easy to work out the frequency value. The program also can calculate THD In this case the X axis is log too, so its easier to see the low frequency peaks since they are separated more. This test used the symmetrical output firmware for the picoverter. pico_2_heavy_filter_bv_better_stop_prefect_symmetry.zip To make the above graph, set the sound card to sample at 22,050Hz and the sample size to 16K, and choose the Blackman (exact) window. ensure the AC signal is 0.5V peak to peak (NOT 0.5V RMS! That will be too much, since 0.5V RMS is 0.71 V p/p) And most importantly, use the "Line In" jack of the PC. Some laptops do not have the Line In input jack and if you use the microphone jack you will overload it and enjoy a heap of noise even when you reduce the signal enough. Line In is the way to go. 0.5% THD is audio amplifier quality output. And this is an inverter.. wronger than a phone book full of wrong phone numbers |
||||
| Pete Locke Senior Member Joined: 26/06/2013 Location: New ZealandPosts: 182 |
Thank's for that BRILLIANT find Poida. I'll bung that on the work laptop to test. Plenty (according to the supplier) of harmonics created at the factory, and rather than take their word for it, or spend zillions on a dedicated meter, this might just be the ticket  Cheers Pete'. |
||||
| KeepIS Guru Joined: 13/10/2014 Location: AustraliaPosts: 1872 |
Hi Peter, a bit late on posting, I've been fighting the dreaded bad Influenza going around for over 4 weeks and finally back to almost normal in the past few days  This subject is timely as I was asked to fix a HIOKI 3197 Power Quality Analyzer, got it all going and I have a loan of it for a few months as reimbursement. The NO Load AC voltage THD is around 1.5% to 2% on my inverter, this then varies with load, as the load increases the THD goes down, with 2kW + of load, mainly induction motors and heating elements, THD is around 1%. Interestingly the higher unloaded THD is due to a 27th and 29th harmonics suddenly appearing. So a quality common mode HF Ferrite choke of 2 or 3 turns should remove those. The Mains AC has almost the same THD with various loads. Obviously it does not have the higher order harmonics. I was able to test the Inverter AC with a Hair dryer that uses a Diode for low Heat, as previously posted, the inverter is now almost silent with that load. The interesting thing is the THD went up to 3% but the cause is the Even harmonics were now showing with the same levels as the Odd harmonics, with content out to around the 27th harmonic. With the Hair Dryer, the AC waveform has that sharp Kink in the side of the Waveform (no ringing) and this is obviously causing a lot of nonliterary in the Toriod, but IMHO perfectly acceptable considering the load. I was able to compare the HIOKI waveforms and harmonic levels to my new RIGOL and while not as neat a display, it was still close to the HIOKI with THD levels and total Harmonics. When I get a chance I will compare it to the Free Software you posted, not to pick on it, but to get a more accurate reference point for the information it displays. I hope to get the HIOKI set up with it's Current clamp(s) and do some serious testing on THD and other variables with respect to other distortion products and test some good HF filters I've wound for the Lower HF bands. BTW: I forgot to add, when the Hair Dryer is placed very close to the inverter AC output, the THD goes up to 11.2%, the Mains AC with that load is 2.6%, IMHO totally meaningless comparison information, but it highlights the roll that the length of AC power wiring, combined with the loads on, and between the Bad load and the inverter, can have on how the inverter reacts to those loads. What I'm trying to say is: Builders have reported that sometimes the Inverter works fine with all the loads for weeks or more, then one day it just goes bang, so many ways for the loads to find any weakness in an inverter over time. Fortunately Mikes (Wiseguy) design appears to be virtually unbreakable when set up correctly - baring a component failure  Edited 2023-07-21 14:24 by KeepIS NANO Inverter: Full download - Only Hex Ver 8.1Ks |
||||
| The Back Shed's forum code is written, and hosted, in Australia. | © JAQ Software 2025 |
