|

|
Forum Index : Electronics : Just what to log
| Author | Message | ||||
| Gizmo Admin Group Joined: 05/06/2004 Location: AustraliaPosts: 5016 |
Maybe a databases 101 is a good idea, as some of your comments dont make sense. A single database file would replace all the text files, and offer more speed and flexability with less CPU and disk drive activity. It wont be affected by spurious unchecked data any more than text files. A database is just a better way of storing and finding data compared to text files, its like comparing a computer to a type writer. You dont need to have Access installed to use Access databases, the VB program can send SQL commands to a empty database file to create and edit tables. Retrieving information from a database is dead easy compared to text files, a simple command like "select * from Logs where logdate>=1/7/2010 and logdate<2/7/2010" is a lot easier than opening several text files. There are SQL commands for retrieving averagesw, maximum's etc, a single command can replace several lines of code. You should look into it. Do a google search for "VB6 and access database" will find lots of info to get you started. Once you start using a database you wont look back. As Vasi suggested, SQLite is another option, but I like Access because its very portable. It doesn't matter what database you use, the commands are almost identical for each type. This web sites uses several Access databases, including the online logging for the PicLog 2. Glenn The best time to plant a tree was twenty years ago, the second best time is right now. JAQ |
||||
| GWatPE Senior Member Joined: 01/09/2006 Location: AustraliaPosts: 2127 |
The windmill analyzer as is can perform the data storage and graph data update and redraw simultanously. I use a mouse to click select various tasks. As for disk activity, my logging computer [atom 1.3GHz] is currently logging 4 apps, and 1 is redrawing 4 updated graphs every second for a 1 hour period, with around 3600 records. The disk activity is about 20ms per second. A scandisk or defrag, or windows startup, or an AI type game is much more intensive use of the disk. I have just run the system monitor on my NetPC [atom 1.3 GHz]running this application doing its thing logging and updating the graphs window in real time as well as running paint and IE8 and explorer, remote desktop and a heap of other minor tasks and the max disk activity was 16kb/s, and normally at 0%. The windmill analyzer is using 13MB and iexplorer 53MB and paint 56MB of memory. The CPU is operating at between 10-20% with a heap of apps running, and when the mouse is moved a bit, the CPU goes up to 30-35%. processing the moving mouse uses almost an much resource. I have database features on my DAVIS weather station software and I don't use it routinely. A couple of times a year, I might look at max-mins and rainfall stats, etc, but not daily. I use the real time daily update and the forecast. The DAVIS uses monthly .wlk files. I suppose if anyone had a database that could already perform the logging and real time update graphing similar to what I have, that they could enlighten us with more than just names of databases. I think that I will leave this now, as I have a program that works within the spirit of a windows environment. The windmill analyzer is more than fast enough and does not hog resources, even without a database engine driving it. Gordon. become more energy aware |
||||
| GWatPE Senior Member Joined: 01/09/2006 Location: AustraliaPosts: 2127 |
Hi readers, I have been working on my windmill analyzer some more and have just done some measurements of recording performance. I had to boost my picaxe test chip up to 32MHz, giving an output Baud rate of 38400. This is in effect a maximum of about 3800 characters per second, or about 38 x 100 char strings per second. It should be noted that at 4800 Baud, the max expected output data string rate would be about 4 of these strings per second. I have been recording to disk once per second of an averaged 20 readings in that interval. At the same time I am able to graphically display a real time update of these readings. The way the program is working, I should be able to replace the digital display window with a real time updating graph of the data channels. The real time digital data becomes a bit of a blurr, so an averaged 1 sec digital display of the present values will be needed instead. I presently have a graph option of the last half hour, the last hour of data, or the days data since midnight. A problem that presents itself with a high data rate, is that of say windspeed and windmill rotor rpm, that are typically calculated with pulse measurements. I am considering looking at an analogue windspeed measurement, and a similar arrangement for windmill rpm. Once the real world sensors are up to the task, I hope to test some more code and see how far I can push up the useful logging rate further. I have a commercial PICOlog hardware unit and I hope to marry an unattended logging app, with a similar updating graph display to it as well. Gordon. become more energy aware |
||||
| GWatPE Senior Member Joined: 01/09/2006 Location: AustraliaPosts: 2127 |
Hi readers, I have finally had a chance to setup an anemometer, dedicated to RE windmill logging purposes. I had an old DAVIS windspeed/direction hardware that had stopped working correctly on my weather station. The unit has an output of 1 pulse per revolution of the cup. Normally this results in measurements down to 1kph on the weather station. With a logger and a decent data rate, the resolution is quite poor. Certainly not suitable with a 1sec count measurement time on a micro, or high logging rates. I had tried using the PULSIN command, but had encountered problems when the cups were spinning very slowly, or stopped. I revisited with a double PULSIN. This involves measuring the length of time of a high pulse, and adding this to length of time of the next low pulse. The time in uS of each was divided by 2 prior to adding. A test for 0 was checked and a value of 32767 was substituted. This overcomes integer maths problems later. Here is a small portion of picaxe 20X2 code. readrpm1: pulsin c.0,1,w0 'test for rising pulse if w0=0 then w0=32767 endif ws=w0/2 pulsin c.0,0,w0 'test for falling pulse if w0=0 then w0=32767 endif w0=w0/2 ws=ws+w0 ws=65534/ws-1 return This code calibrates to give a resolution of 0.5kph within the std output data stream. If I had used the COUNT command then the resolution would be about 2kph. Higher resolutions can result with digital integration as well. Windspeed is a particularly difficult parameter to display accurately. I have been tempted to display calculated values, but have found like others that displaying fractions of kph windspeed do not have much meaning. If I had a rotary encoder type sensor instead of a reed switch, then higher resolution might be possible. I have not tested this on a picaxe08M, but using PULSIN instead of COUNT should allow a faster measurement routine without losing measurement resolution. One should note that if possible all measurements should be taken in the same time slice. The micro data output may still occur every few seconds, but the readings can be taken within a few tenths of a second, and a pause used to fill the time. Better correlation of RPM,windspeed, voltage and amps/power on say a winmill will result when the measurements are taken this way, instead of over a few seconds. Gordon. become more energy aware |
||||
| GWatPE Senior Member Joined: 01/09/2006 Location: AustraliaPosts: 2127 |
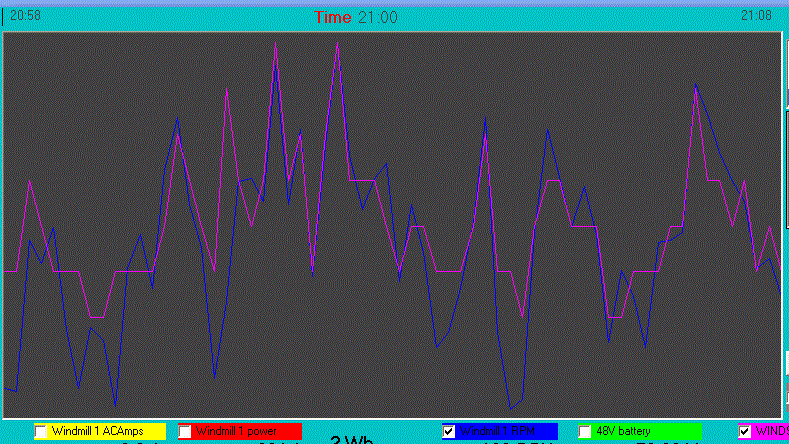
Hi readers, I have reworked the picaxe code a bit more, and the mods have resulted in good correlation between the windspeed and windmill rpm. A side benefit is that as the windspeed and rpm increase, the data rate increases. At low windspeeds and rpm, the data rate for measuring 11 analogue channels and 3 digital channels is around 0.8 readings per second. At windmill cutin rpm [approx 150rpm], the data rate has increased to approx 1.3 readings per second. I am expecting the data rate to increase to approx 2/sec. The micro is presently running at only 4MHz. I will be exploring higher chip speeds and baud rates. There are many benefits with upping these. I believe the good correlation of the measurements is a direct result of the improved measurements in time. A lot can change in a few seconds with a windmill. The higher speeds will help with a real time graphing app as well. I will be testing a picaxe 08M at 8MHz. The 4 channels will be processed very quickly, and will allow many data points to be integrated in the PC, even at logging intervals as short as 0.5sec. The picaxe program is fast enough to reject successive data pairs that do not match, so the data quality is improved before it is sent to the PC. Gordon. PS here is a 10min, portion of data at 10sec intervals. Blue is rpm, pink is windspeed. 
On occasions the rpm lags the windspeed, but generally the rpm correlates the windspeed. This windmill generally responds quickly to the changing windspeed. become more energy aware |
||||
| GWatPE Senior Member Joined: 01/09/2006 Location: AustraliaPosts: 2127 |
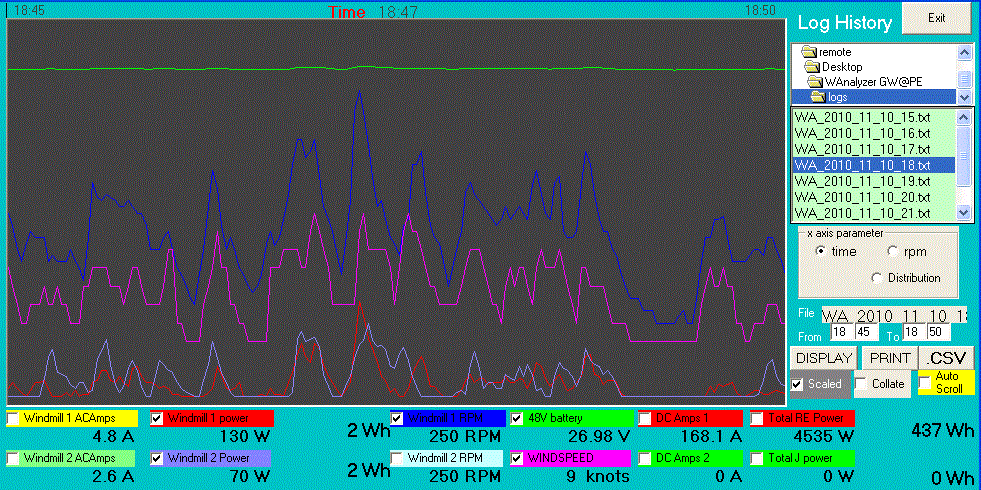
Hi readers, well I finally have 2 windmills recording on the same logger, with the same battery loading and with windspeed as well. The two windmills have the same bladesets, and one has a boost maximizer, and the other has a Buck MPPT. One alternator is my original approx 500W peak 4phase 44coils stator aluminium plate machine, with 22cu inch of magnets, and the other is my latest unit with 3phase 9coils, 36cu inch of magnets. The 2 machines are as different as chalk and cheese, but with MPPT, they produce very close to the same power with the same blade sets. The windmills are in close proximity to each other. I am now in a great position to make changes to one and directly compare to a fixed unit. I have plans to make some more graphs available on my windmill analyzer. I am looking at real time plots of rpm v windspeed, and power v windspeed, in addition to power v rpm and power distribution. I will look at windspeed distribution and wind energy distribution. Here is a portion of some data, showing the good correlation of the windmills rpm to windspeed, and the good correlation of power output between different windmills with the same rotor area, but different alternators, and the correlation of the windmill power output with the windspeed. I don't have data yet for a wide spectrum of windspeeds. 
The two different MPPT systems have made each windmill perform well. Windmill 1 is an early cutin windmill that stalls very early on 24V battery. Windmill 2 is a late cutin windmill that produces power normally after approx 350rpm. The logging has allowed me to directly compare important windmill operating measurements. It is reassuring to see windmill output power correlating so well to available wind energy, and the rotors closely tracking the windspeed, even for completely different controller mechanisms. Gordon. become more energy aware |
||||
| GWatPE Senior Member Joined: 01/09/2006 Location: AustraliaPosts: 2127 |
Hi readers, My 2 windmills are very different in alternator design with the same rotors, and completely different MPPT connected. Here is a comparison of the ouutputs from the mills today. Not too much wind. 
there is only 15 parts in 500 difference in recorded output Wh for the day so far. This combined with the close tracking of the power output to the wind energy curve indicates that the MPPT are working well. There is still some variability in reproducibility due to the high data sampling rate though. The recording of the 2 windmills power simultanously with windmill rpm and windspeed overcomes the difficulties with matching up data from different program sources. I am now confident in making changes to either windmill and then comparing output performances. The 2 windmills in close proximity, with the same rotors can produce similar daily output power. The next step is to test and log output performance of some other blade combo's. Gordon. become more energy aware |
||||
| GWatPE Senior Member Joined: 01/09/2006 Location: AustraliaPosts: 2127 |
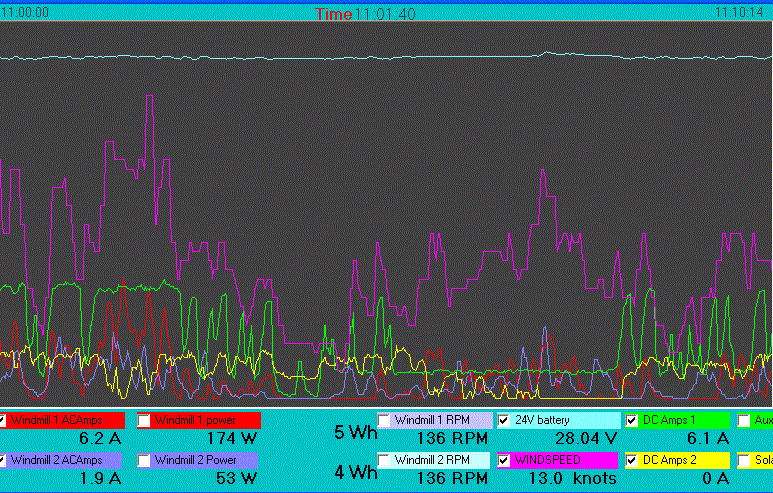
I have just completed a rewire of my RE setup. I had previously used a 24V & a 48V loading arrangement on my RE. I had 24 & 48 loading on my windmills, and the solar was 24V only. Surplus RE power from the house battery inverter system was redirected back to 48V and exported back to the grid through the 48V windmill battery and GTI. This has worked well, but I scored an Outback brand solar MPPT, and this has a common earth, so it simplifies the solar and 24V battery. I have reworked all the windmills to supply the 24V battery as well. The 1200W 25-55V PowerJack GTI is connected to my 24V battery and DC controlled by SSRelay from the diversion load control from the Outback MPPT. The question of how a windmill and solar panels and GTI work together has been raised at numerous times. I have finally added current sensors to each windmill and the solar and the GTI leads. These are connected to my Picaxe 20X2 logger board, and I am recording at 1sec intervals. The data is very telling, and confirms the problems that would be encountered with say an outback solar MPPT on a windmill, and the cyclic loading of the PowerJack GTI. The diversion loading control output from the Outback operates within the battery recharging requirments of absorbtion voltage and float voltage. The relay control is toggled on or off and the diversion load [PowerJack GTI] loads to maintain the various battery voltages. The PowerJack starts ramping up the loading when first activated. It then plateaus at a relatively fixed loading, and continues to drag the battery voltage down until the diversion level setting voltage is reached which turns it OFF. The battery voltage starts to rise again and the relay turns on again, and the cycle repeats. This is a natural process, as it is not possible to synchronize the PowerJack precisely, as there are preset internal voltage limits in it that would normally discharge the battery too much, and would actually cycle the battery instead of bleed OFF surplus power. Only with the logging of data at a decent rate [1sec intervals] for all the parameters has the real behaviour of these interactions been evident. here is a graph of just over 10 minutes activity. 
The Yellow is Solar RE 24VDC current the Green is GTI export 24VDC current the Red is newer AxFx windmill 24VDC current the Blue is control AxFx windmill 24VDC current the Lt Blue is the battery voltage the Purple is the windspeed The cyclic loading of the PowerJack GTI is evident, and OFF periods that occur with normal operation of the Outback MPPT. The windmills just do their thing. At low surplus power levels, the powerjack did stay connected with 1.4A. The outback was OFF during this time, and the windmills were providing varying currents. There seems to be a low threshold current to maintain a GTI connection. I still have to add more solar to the mix, and storm events will still need to be monitored for the windmills. This is to check the maximum power handling of the GTI. In the event of mains failure, the GTI will be OFF, and the windmills will shut down at a preset 29.5V. Until then the windmills and solar will alternate to supply just enough power to the static loads. If there is a lot of surplus, then the solar and windmills will shut down. I will maintain the logging until all these conditions have been monitored. Gordon. become more energy aware |
||||
| GWatPE Senior Member Joined: 01/09/2006 Location: AustraliaPosts: 2127 |
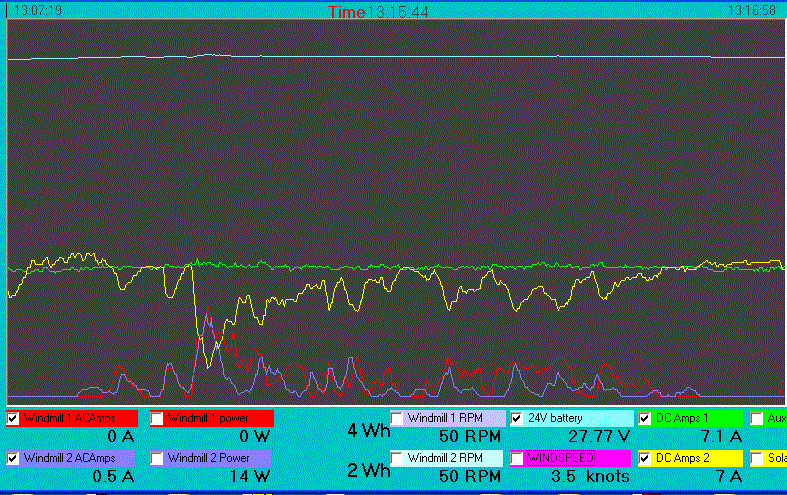
I have some more interesting interactions between a solar MPPT, windmills and a GTI diversion loading on a RE battery system. It seems that the solar MPPT is faster response than the GTI, and it shuts down the solar as the windmills provide additional power to the battery. The GTI is too slow to respond to the extra windmill current, so the solar MPPT backs off to maintain the same battery float voltage.. Here is the graph, labels like above. Notice the mirror image aspect of the yellow graph to the red and blue graphs. 
The systems will not be able to effectively maintain a maximum export power function. If the windmills supply more current than the solar, then the battery voltage will rise, and then more power may be exported. It does seem like a hybrid system with commercial components will still not be as good as custom components. I will look into using the 48V GTI, directly connected to the Solar panel, with a similar control relay to make more efficient export use of this power. Gordon. become more energy aware |
||||