
|
|
Forum Index : Microcontroller and PC projects : Plotter package a la HP9800-series BASIC
| Author | Message | ||||
| NPHighview Senior Member Joined: 02/09/2020 Location: United StatesPosts: 221 |
To become familiar with CMM2 and mmBasic, I've written a little plotter package that generates scaled 2D plots with axis labeling and (naive) clipping. Two sample plots get generated by the "Main Program" code after all the subs and functions. I've commented the code fairly diligently. Please let me know if this is of any interest. 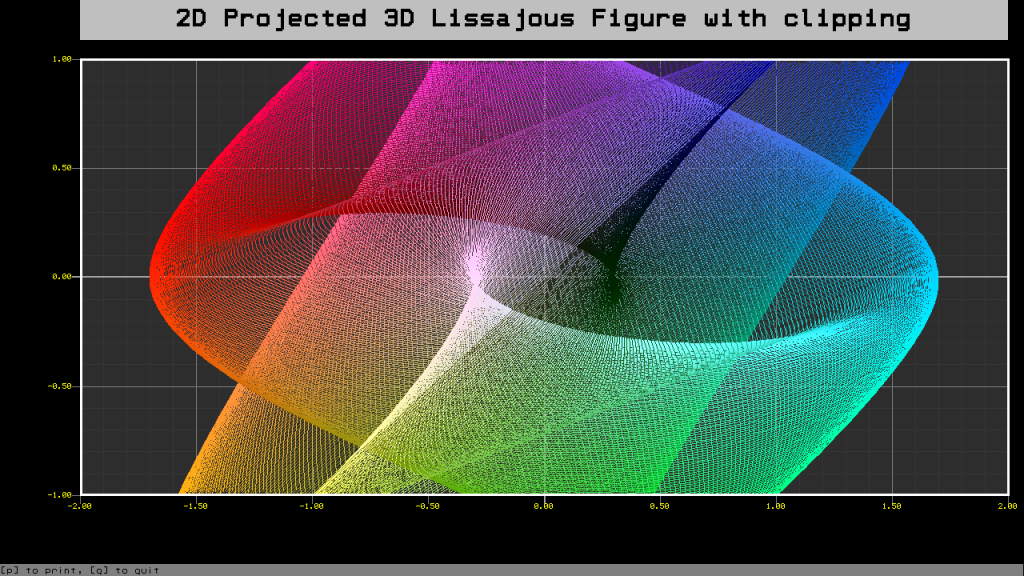 ' plotplan.bas - HP9800-style plotting on the CMM2 ' This should be fairly mode-independent. ' ' Note use of OPTION Y_AXIS UP to place 0 at the bottom. ' ' Steve "NPHighview" Johnson October 2020 ' Please contact me via TheBackShed Forum for any questions ' ' Public Domain - Free / Unrestricted Public Use ' ***************************************************************************** ' Set Up Environment ' ***************************************************************************** OPTION BASE 0 : OPTION EXPLICIT OPTION ANGLE DEGREES OPTION Y_AXIS UP DIM INTEGER hres%, vres%, vmode%, vdepth%, x%, y%, i%, j% DIM STRING key$, title$, x_label$, y_label, halign$(2), valign$(2) DIM FLOAT defaultMode DIM STRING x_lbl$, y_lbl$ ' Naming Convention: ph: Physical gr: Graph tl: Title Box sc: Scaled DIM INTEGER ph_x_min, ph_x_max, ph_x_ctr, ph_x_ext, ph_y_min, ph_y_max, ph_y_ctr, ph_y_ext ' Physical dimensions DIM INTEGER gr_x_min, gr_x_max, gr_x_ctr, gr_x_ext, gr_y_min, gr_y_max, gr_y_ctr, gr_y_ext ' Graph dimensions DIM INTEGER tl_x_min, tl_x_max, tl_x_ctr, tl_x_ext, tl_y_min, tl_y_max, tl_y_ctr, tl_y_ext ' Title dimensions DIM FLOAT sc_x, sc_y, last_sc_x, last_sc_y ' Scaled graph parameters. Displays in physical graph area DIM FLOAT sc_x_div, sc_x_min, sc_x_max, sc_x_inc, sc_x_ext DIM FLOAT sc_y_div, sc_y_min, sc_y_max, sc_y_inc, sc_y_ext DIM FLOAT theta, phi, x_3d, y_3d, z_3d, x_2d, y_2d DIM INTEGER red_val, grn_val, blu_val, col_val ' ***************************************************************************** ' Define functions and subs ' ***************************************************************************** FUNCTION LOG10(v) as FLOAT ' returns logarithm base 10 of input value IF v <= 0.0 THEN LOG10 = -9.99E19 ' truncate at zero' LOG10 = log(v)/log(10) ' works regardless of the base for mmBasic's log function END FUNCTION SUB SetPlotParams screenMode, colorDepth ' Establish plot params based on video mode LOCAL STRING Mode_Depth ' Best if used with high-res modes' if screenMode < 1 OR screenMode > 13 then EXIT SUB else screenMode = INT(screenMode) if colorDepth < 8 OR colorDepth > 16 then EXIT SUB else colorDepth = INT(colorDepth) if screenMode = 9 AND colorDepth = 12 then colorDepth = 8 ' OK, mode 9 is weird Mode screenMode,colorDepth ' Set video mode and color depth ' Must set the mode to get the resolutions from MM. CLS hres% = MM.hres ' get the actual horizontal resolution from the hardware vres% = MM.vres ' get the actual vertical resolution from the hardware defaultMode = MM.INFO(MODE) ' get the actual video mode from the hardware ' Based on screen mode, set all of the plotter parameters ph_x_min = 0 : ph_x_max = hres%-1 : ph_x_ctr = INT(hres%/2) : ph_x_ext = hres% ph_y_min = 0 : ph_y_max = vres%-1 : ph_y_ctr = INT(vres%/2) : ph_y_ext = vres% ' Graph dimensions gr_x_min = 100 ' relatively arbitrary - leaves room for Y axis label and Major Axis values gr_x_max = hres% - 20 ' leaves room on the right. May not be needed gr_x_ext = gr_x_max - gr_x_min gr_x_ctr = gr_x_min + gr_x_ext/2 gr_y_min = 100 ' relatively arbitrary - leaves room for X axis label, tick values and status line gr_y_max = vres% - 75 ' leaves room on top for the graph Title gr_y_ext = gr_y_max - gr_y_min gr_y_ctr = gr_y_min + gr_y_ext/2 ' Title dimensions tl_x_min = gr_x_min tl_x_max = gr_x_max tl_x_ctr = gr_x_ctr tl_x_ext = gr_x_max - gr_x_min tl_y_min = vres% - 50 ' relatively arbitrary - room on top of title. May not be needed tl_y_max = vres% ' a little space between title and graph area tl_y_ext = tl_y_max - tl_y_min tl_y_ctr = tl_y_min + tl_y_ext/2 ' Scaled Operations last_sc_x = 0 last_sc_y = 0 END SUB SUB DrawPlotArea xmin, xmax, ymin, ymax, xjdiv, yjdiv, xndiv, yndiv ' draw background, axes, labels of plot area. LOCAL x, y, xjinc, yjinc, xninc, yninc, xval, yval ' floats. "j" for maJor, "n" for miNor tic marks LOCAL sc_x_e10, sc_y_e10, xval_trnc, yval_trnc ' truncated (base 10) scaled extents and values LOCAL STRING xval_disp, yval_disp ' truncated string values ' Set scaled graph values from parameters passed here. No need to bother user with all this stuff sc_x_min = xmin sc_x_max = xmax sc_y_min = ymin sc_y_max = ymax sc_x_ext = xmax - xmin ' ext is "extent" sc_y_ext = ymax - ymin sc_x_e10 = 2-FIX(LOG10(ABS(sc_x_ext))) ' calculates the number of digits to display on axis labels sc_y_e10 = 2-FIX(LOG10(ABS(sc_y_ext))) ' calculates the number of digits to display on axis labels sc_x_div = sc_x_ext / xjdiv sc_y_div = sc_y_ext / yjdiv xjinc = gr_x_ext/xjdiv ' calculate the physical increment for the maJor divisions yjinc = gr_y_ext/yjdiv xninc = xjinc/xndiv ' calculate the physical increment for the miNor divisions yninc = yjinc/yndiv BOX gr_x_min, gr_y_min, gr_x_ext, gr_y_ext, 1, &H303030, &H303030 ' dark grey background for x = gr_x_min to gr_x_max+1 step xninc ' Minor X Axis tick marks LINE x, gr_y_min, x, gr_y_max, 1, &H383838 ' draw inside the plot box next x for y = gr_y_min to gr_y_max+1 step yninc ' Minor Y Axis tick marks LINE gr_x_min, y, gr_x_max, y, 1, &H383838 ' draw inside the plot box next y xval = xmin for x = gr_x_min to gr_x_max+1 step xjinc ' Major X Axis xval_disp = STR$(xval,0,sc_x_e10) ' Display specified resolution of scaled value xval_trnc = val(xval_disp) ' May result in a value of -0.000 (!!) IF xval_trnc = 0 THEN ' Strangely, -0.00 equates to zero. LINE x, gr_y_min-10, x, gr_y_max, 2, &HA0A0A0 ' Subtly emphasize zero crossing by widening axis line xval_disp = STR$(0,0,sc_x_e10) ' Avoid showing a "-0.00". Show 0 to spec. resolution TEXT x, gr_y_min-10, xval_disp, CT, 7, 1, RGB(yellow), -1 ELSE LINE x, gr_y_min-10, x, gr_y_max, 1, &H808080 TEXT x, gr_y_min-10, xval_disp, CT, 7, 1, RGB(yellow), -1 END IF xval = xval + (xmax-xmin)/xjdiv next x yval = ymin ' Keep track of scaled values for y = gr_y_min to gr_y_max+1 step yjinc ' Major Y Axis yval_disp = STR$(yval,0,sc_y_e10) ' Display specified resolution of scaled value yval_trnc = val(yval_disp) ' May result in a value of -0.00 (!!) IF yval_trnc = 0 THEN ' Strangely, -0.00 equates to zero. LINE gr_x_min-10, y, gr_x_max, y, 2, &HA0A0A0 ' Subtly emphasise zero crossing by widening axis line yval_disp = STR$(0,0,sc_y_e10) ' Avoid showing a "-0.00". Show 0 to spec. resolution Text gr_x_min-10, y, yval_disp, RM, 7, 1, RGB(yellow), -1 ELSE LINE gr_x_min-10, y, gr_x_max, y, 1, &H808080 Text gr_x_min-10, y, yval_disp, RM, 7, 1, RGB(yellow), -1 END IF yval = yval + (ymax-ymin)/yjdiv next y ' draw outline around graph area, on top of tick marks BOX gr_x_min, gr_y_min, gr_x_ext+2,gr_y_ext+2, 3, &HFFFFFF END SUB SUB TitleBox TitleString$ ' draws a graph title centered over the graph area BOX tl_x_min, tl_y_min, tl_x_ext, tl_y_ext, 1, &HC0C0C0, &HC0C0C0 ' box for title string for x% = tl_x_ctr-1 to tl_x_ctr+1 step 2 ' Make the title Bold for y% = tl_y_ctr-1 to tl_y_ctr+1 step 2 TEXT x%, y%, TitleString$, CM,4, 2, &H000000, -1 next y% next x% END Sub SUB LabelAxes xl$, yl$ ' draw axis labels TEXT ph_x_min+2, gr_y_ctr, yl$, LM, 4, 1, RGB(cyan), -1 ' start just off left edge TEXT gr_x_ctr, (gr_y_min+16)/2, xl$, CM, 4, 1, RGB(cyan), -1 ' start just above message area END SUB SUB Move Plot_x, Plot_y ' Moves (without drawing) the virtual pen. A move must precede the first Plot last_sc_x = Plot_x last_sc_y = Plot_y ' WaitStatus "Move to "+STR$(Plot_x)+", "+STR$(Plot_y), &H000000 END SUB FUNCTION Contained (value, l_bound, u_bound) AS INTEGER ' Range check. Used in clipping the plot IF MIN(l_bound, u_bound) <= value AND value <= MAX(l_bound, u_bound) THEN Contained = 1 ELSE Contained = 0 END FUNCTION SUB Draw Plot_x, Plot_y, Width, PenColor ' Plot with naive clipping. LOCAL INTEGER x1,y1,x2,y2, old_contained, new_contained x1 = gr_x_min + INT((gr_x_ext * (last_sc_x - sc_x_min) / sc_x_ext)) y1 = gr_y_min + INT((gr_y_ext * (last_sc_y - sc_y_min) / sc_y_ext)) IF Contained(x1, gr_x_min, gr_x_max) AND Contained(y1, gr_y_min, gr_y_max) THEN old_contained = 1 else old_contained = 0 x2 = gr_x_min + INT((gr_x_ext * (Plot_x - sc_x_min) / sc_x_ext)) y2 = gr_y_min + INT((gr_y_ext * (Plot_y - sc_y_min) / sc_y_ext)) IF Contained(x2, gr_x_min, gr_x_max) AND Contained(y2, gr_y_min, gr_y_max) THEN new_contained = 1 else new_contained = 0 ' PauseStatus "Draw to "+STR$(Plot_x)+", "+STR$(Plot_y)+" ("+STR$(x1)+","+STR$(y1)+") to ("+STR$(x2)+","+STR$(y2)+")", 0 ' FOR CLIPPING, we must evaluate whether the new or old coordinates are within the plot area. ' If both new and old are inside the plot area, go ahead and draw the line. IF (old_contained + new_contained) = 2 THEN LINE x1, y1, x2, y2, 1, PenColor ' both are inside. Easy peasy! ' If old and new are both outside the plot area, don't draw the line at all. ' If one is inside and the other is outside (doesn't matter which), don't draw the line at all (for now). ' Later, we'll find the point on the edge that is on the line, draw from the inside point to that point. last_sc_x = Plot_x : last_sc_y = Plot_y ' No matter what, update the last scaled x & y. END SUB SUB Point Plot_x, Plot_y, Diameter, Color ' Plot a dot at the scaled coordinates. Naive clipping. LOCAL INTEGER x1, y1, old_contained, new_contained x1 = gr_x_min + INT((gr_x_ext * (Plot_x - sc_x_min) / sc_x_ext)) y1 = gr_y_min + INT((gr_y_ext * (Plot_y - sc_y_min) / sc_y_ext)) IF Contained(x1,gr_x_min,gr_x_max) AND Contained(y1,gr_y_min,gr_y_max) THEN CIRCLE x1, y1, Diameter, 1, 1, Color, Color last_sc_x = Plot_x last_sc_y = Plot_y END SUB SUB DisplayStatus Message$, Color ' Shows a status message at the bottom of the screen. BOX ph_x_min, ph_y_min, ph_x_max, 15, 1, &H808080, &H808080 ' Box for status line TEXT ph_x_min, ph_y_min, Message$, LB, 1, 1, Color, -1 END SUB SUB PauseStatus Message$, Color ' Shows message, then waits one second LOCAL STRING k$ DisplayStatus Message$, Color Timer = 0 : DO WHILE Timer < 1000 : LOOP END Sub SUB WaitStatus Message$, Color ' Shows message, waits for a keypress LOCAL STRING k$ DisplayStatus Message$+" Press any key to continue.", Color Timer = 0 : DO WHILE Timer < 1000 : LOOP k$ = inkey$ : DO WHILE k$ = "" : k$ = inkey$ : LOOP END Sub SUB ClearStatus ' Clears message area BOX ph_x_min, ph_y_min, ph_x_max, 15, 1, &H000000, &H000000 ' Box for status line END SUB ' ***************************************************************************** ' Main Program ' ***************************************************************************** ' Example drawing trigonometric functions ' ***************************************************************************** SetPlotParams 11, 16 ' Video mode and color depth. Values combined inside subroutine TitleBox STR$(defaultMode)+": Trig Functions incl Sin"+CHR$(253) ' superscript 2 DrawPlotArea -270.0, 270.0, -2.0, 2.0, 12, 10, 5, 5 ' draw axis tick marks. Majors cross; minors inside LabelAxes "Angle "+ CHR$(&HE9) + " (deg)", "Volts" Move -270, SIN(-270) ' must Move before a Draw command for theta = -270 to 270 step 10 ' in degrees Draw theta, SIN(theta), 2, RGB(red) Point theta, SIN(theta), 2, RGB(red) next theta Move -270, COS(-270) for theta = -270 to 270 step 10 ' in degrees Draw theta, COS(theta), 2, RGB(blue) Point theta, COS(theta), 2, RGB(blue) next theta Move -270, (SIN(-270))^2 for theta = -270 to 270 step 1 ' in degrees Draw theta, (SIN(theta))^2, 2, RGB(green) ' Point theta, (SIN(theta))^8, 2, RGB(green) next theta BOX gr_x_min, gr_y_min, gr_x_ext+2,gr_y_ext+2, 3, &HFFFFFF ' draw border again to clear up any oopsies' DisplayStatus "[p] to print, [c] to continue", &H000000 key$ = "" DO WHILE key$ <> "Q" key$ = UCASE$(inkey$) SELECT CASE key$ CASE "C" EXIT DO CASE "P" ' Print Screen - saves to .BMP file SAVE IMAGE "plotplan"+STR$(defaultMode)+".BMP" END SELECT LOOP ' ***************************************************************************** ' 2D color projection of 3D Lissajous ' ***************************************************************************** SetPlotParams 11, 16 ' Video mode and color depth. Values combined inside subroutine DisplayStatus "Please wait while drawing...", &HFFFF00 TitleBox "2D Projected 3D Lissajous Figure with naive clipping" DrawPlotArea -2.0, 2.0, -1.0, 1.0, 8, 4, 5, 5 ' draw axis tick marks. Majors cross; minors inside FOR theta = 0 to 14400 step .125 ' ensures thick coverage of the figure x_3d = SIN(11.1*theta) ' calculate 3D lissajous points y_3d = SIN(11.125*theta) z_3d = COS(11.15*theta) x_2d = x_3d - .7*z_3d ' project them onto a 2D plane y_2d = y_3d - .7*z_3d IF theta=0 THEN Move x_2d, y_2d ELSE Draw x_2D, y_2d, 2, (127*(1-z_3d) + ((127*(1-y_3d)) << 8) + ((127*(1-x_3d)) << 16)) NEXT theta BOX gr_x_min, gr_y_min, gr_x_ext+2,gr_y_ext+2, 3, &HFFFFFF ' draw border again to clear up any oopsies' DisplayStatus "[p] to print, [q] to quit", &H000000 key$ = "" DO WHILE key$ <> "Q" key$ = UCASE$(inkey$) SELECT CASE key$ CASE "Q" EXIT DO CASE "P" ' Print Screen - saves to .BMP file SAVE IMAGE "plotplan"+STR$(defaultMode)+".BMP" END SELECT LOOP cls end Live in the Future. It's Just Starting Now! |
||||
| panky Guru Joined: 02/10/2012 Location: AustraliaPosts: 1127 |
Very nice Steve, been thinking of something like this for a while to graph/plot some battery discharge curves - you have saved me a lot of work! Thanks, Doug. ... almost all of the Maximites, the MicromMites, the MM Extremes, the ArmMites, the PicoMite and loving it! |
||||
| NPHighview Senior Member Joined: 02/09/2020 Location: United StatesPosts: 221 |
Hi, Doug - Thanks! I've also been playing with an oscilloscope version, not yet ready to show. I'm attempting to do the display as a relatively fixed backdrop of the plot area, with another "live" display plane on top of it. However, I'm still plowing my way through the examples and documentation, and it's still not behaving for me :-) Steps for improvement here: * Use Peter's matrix functions to do a better job with clipping calculations (vector dot products) * read from a previously-recorded data file (like your battery discharge curves) to generate the plot points. I don't particularly relish the thought of writing an XML parser for this, so maybe revert to the 1990's "Data Interchange Format" file structure, or even CSV. * have a "light" mode setting as well as this "dark" mode version. A "light" mode would look better when inserted into documents, but the dark mode sure looks good on a screen :-) - Steve Live in the Future. It's Just Starting Now! |
||||
| JohnS Guru Joined: 18/11/2011 Location: United KingdomPosts: 4335 |
Looks good. There's a mode (12 IIRC) which might help with the overlaying of a fixed backdrop. John |
||||
| lizby Guru Joined: 17/05/2016 Location: United StatesPosts: 3782 |
A beautiful example and a beautiful program. Program organization, capitalization of BASIC keywords, variable naming convention, comments--all very craftsmanly done. There's a lot to learn from here stylistically as well as functionally. Congratulations. PicoMite, Armmite F4, SensorKits, MMBasic Hardware, Games, etc. on FOTS |
||||
| Paul_L Guru Joined: 03/03/2016 Location: United StatesPosts: 769 |
Hmmmmpf! A likely story! This is not a first timer program. Very nice! However, I think I spotted some detail gotchas. You must be a FORTRAN guy because I see this line DIM INTEGER hres%, vres%, vmode%, vdepth%, x%, y%, i%, j% Now, everybody knows that i and j must always be integers, but, you're being redundant. You used INTEGER and all those "%" integer marks. Choose one, either INTEGER or % after each variable.Then there is this line DIM FLOAT theta and then this loopFOR theta = 0 to 14400 step .125 � � � � � � � � �' ensures thick coverage of the figure where theta has to be a FLOAT because the step is 0.125.x_3d = SIN(11.1*theta) � �' calculate 3D lissajous points y_3d = SIN(11.125*theta) z_3d = COS(11.15*theta) x_2d = x_3d - .7*z_3d � � ' project them onto a 2D plane y_2d = y_3d - .7*z_3d IF theta=0 THEN Move x_2d, y_2d ELSE Draw x_2D, y_2d, 2, (127*(1-z_3d) + ((127*(1-y_3d)) << 8) + ((127*(1-x_3d)) << 16)) NEXT theta Of course, it would be prettier if you did this �IF theta=0 THEN � �Move x_2d, y_2d �ELSE � �Draw x_2D, y_2d, 2, (127*(1-z_3d) + ((127*(1-y_3d)) << 8) + ((127*(1-x_3d)) << 16)) �ENDIF The then we see several repetitive loops like this for theta = -270 to 270 step 10 ' in degrees which will work but it might or might not run faster if theta were an integer.�Draw �theta, SIN(theta), 2, RGB(red) �Point theta, SIN(theta), 2, RGB(red) next theta And, you forgot that you are a FORTRAN guy. You never used i% or j% anywhere. You could use i% or j% in these DRAW and POINT loops and they might run faster. However you should not do this for i%= -270 to 270 step 10 because the presence of all those "%"s will slow the interpreter down because it has to check to see that it is incrementing an integer for each loop.�Draw �i%, SIN(i%), 2, RGB(red) �Point i%, SIN(i%), 2, RGB(red) next i% It could be written like this DIM INTEGER i, j ...... for i= -270 to 270 step 10 �Draw �i, SIN(i), 2, RGB(red) �Point i, SIN(i), 2, RGB(red) next i BUT THIS MUST BE TESTED. It might just be that the interpreter has to convert the i% to a temporary float before it can execute SIN(i%). This could be the oddball situation where a float could be faster than an integer because of the possible need to convert the i% to a temporary internal float every time the SIN(i%) is encountered. Peter would be able to answer this, or you could just test it by timing the loops in both configurations. Also, at the top of the file we see this FUNCTION LOG10(v) as FLOAT � � � � � ' returns logarithm base 10 of input value I don't think the truncation at zero will work since you reassign LOG10 unconditionally in the next step. IF v <= 0.0 THEN LOG10 = -9.99E19 �' truncate at zero' LOG10 = log(v)/log(10) � � � � � � ' works regardless of the base for mmBasic's log function END FUNCTION Could it be that this what you intended to do? FUNCTION LOG10(v) as FLOAT � � � � � ' returns logarithm base 10 of input value IF v <= 0.0 THEN � LOG10 = -9.99E19 �' truncate at zero' else � LOG10 = log(v)/log(10) � � � � � � ' works regardless of the base for mmBasic's log endif function END FUNCTION Interpreters can be very tricky. Sometimes the fastest way winds up being slower. It's all in the details. I got this picky because I started out hand sorting decks of scrambled Hollerith cards containing machine code instructions. Hint, if you use MMEDIT to write your code it has an excellent automatic indent function which will vividly show the structure of your code. It will catch a lot of screwed up test structures for you. Paul in NY Edited 2020-10-18 01:09 by Paul_L |
||||
| NPHighview Senior Member Joined: 02/09/2020 Location: United StatesPosts: 221 |
Paul and other commentators - Thanks for the close code inspection! �You're right; this isn't my first rodeo. �But not FORTRAN (bleccch!) �I've written in HP Basic, PL/M, C, C#, C++, PL/SQL, Haskell, F#, Pascal, and a bunch of other languages. �I'm also playing with the wonderful SwissMicros Hewlett-Packard-like DM42 and DM41X calculators. And you're absolutely right about the LOG10 code; I'm embarassed to say that I missed that late one night and didn't pick it up later in my testing. You did pick up that I'm not always using MMEdit. �There are some things I just can't live without: * Global search & replace * Keyboard shortcuts (Shift-arrow to select, Ctrl-arrow to skip from word to word, etc.) So I wind up using Atom or Notepad++, then move the SD card to the CMM2 for final checkout. �Tabs get converted to spaces along the way, sometimes inconsistently. If anyone else finds a bug, I would be very happy to hear about it. - Steve Edited 2020-10-18 02:43 by NPHighview Live in the Future. It's Just Starting Now! |
||||
| William Leue Guru Joined: 03/07/2020 Location: United StatesPosts: 411 |
Looks very nice! It appears that as written, it needs one of the 5.05.06 release candidate firmware versions because of things like OPTION ANGLE DEGREES. It might be good to include that caviat in the top-line comments. -Bill |
||||
| NPHighview Senior Member Joined: 02/09/2020 Location: United StatesPosts: 221 |
Thanks, Bill. The plotter package, per se, doesn't need the OPTION ANGLE, though the Lissajous and Sine plots do use them (and even they really don't need 'em). � �I will put some notes up top to that effect. �My intention is to package this as an .inc, minimizing version dependencies as much as I can. I do use OPTION EXPLICIT, as I'm a big fan of strongly-typed languages (exposes lots of "silent" type-conversion problems). �Haskell really lit up my brain on that one, especially after decades of C programming. �However, once debugged, I can remove OPTION EXPLICIT with no problem. I also use OPTION Y_AXIS UP, which does require 5.05.xx, i believe. �I started trying to get a version to work regardless of the Y Axis orientation, but just couldn't wrap my head around all of the issues involved :-) �Peter is working on getting the bitmap capture to work correctly with OPTION_Y_AXIS UP; I had to flip the image to show it, above. Speaking of Haskell, I'm really intrigued by the existence of mmBasic's EVAL function. �Haskell offers lazy evaluation, map/reduce, currying, tail recursion, and other "contemporary" language features, and the EVAL function just might enable mmBasic to do some of them, at least. � - Steve Edited 2020-10-18 04:08 by NPHighview Live in the Future. It's Just Starting Now! |
||||
| matherp Guru Joined: 11/12/2012 Location: United KingdomPosts: 11499 |
If you download RC4 now it should be fixed. The code you have created is great  Edited 2020-10-18 04:16 by matherp |
||||
| vegipete Guru Joined: 29/01/2013 Location: CanadaPosts: 1179 |
Neat program. And more time spent figuring out "How he dunnit?" Although it does demonstrate that I must get my oscillator mod done. If you are going to 'Hmmmmpf' about this, perhaps a better change would be examine why the "IF" is there in the first place and determine how to remove it:  Move -0.7, -0.7 FOR theta = 0.125 to 14400 step .125 ' ensures thick coverage of the figure x_3d = SIN(11.1*theta) ' calculate 3D lissajous points y_3d = SIN(11.125*theta) z_3d = COS(11.15*theta) x_2d = x_3d - .7*z_3d ' project them onto a 2D plane y_2d = y_3d - .7*z_3d Draw x_2D, y_2d, 2, (127*(1-z_3d) + ((127*(1-y_3d)) << 8) + ((127*(1-x_3d)) << 16)) NEXT theta Visit Vegipete's *Mite Library for cool programs. |
||||
| NPHighview Senior Member Joined: 02/09/2020 Location: United StatesPosts: 221 |
Wow - comments from Peter and Vegipete! I'm honored. Again, this is a wonderful ecosystem and community. Thank you! I'm looking forward to the next firmware release. - Steve Live in the Future. It's Just Starting Now! |
||||
| Sasquatch Guru Joined: 08/05/2020 Location: United StatesPosts: 385 |
Very Nice! This will be very useful. Yes, I am Very Interested!A couple of things I noticed: 1. You could use "rotated" text (90 deg) for Y-Axis label. See "Text" command in manual. This would give even more space on screen for the graph. 2. Would be nice to have a routine that would accept arrays for the X and Y data points and plot them with option to have X axis be the index of the data point. 2. Would be great to have some kind of intelligent "Auto Scale" routine. This would likely need to parse through the data once (in an array?) to determine Min/Max of data and then choose Min/Max for the graph axis based on some power of 10 and give nice even increments for the scale of the major and minor tics. I may have some code for this around somewhere but it would take some time to find, or shouldn't be too difficult to think through. Please take this as constructive suggestions, I think you have done a great job with this and I plan to use it. -Carl |
||||
| NPHighview Senior Member Joined: 02/09/2020 Location: United StatesPosts: 221 |
Thanks, Carl! 1. Just found the reference on p. 30 of the CMM2 User Manual 5.05.05 - thanks for the nudge. I agree - very, very desirable. The firmware version I've got does some really strange things with the different orientations; I'll have to try Peter's most recent. 2. Arrays, or specify a data file to read; either Data Interchange Format or CSV; I'm not going to write an XML parser in mmBasic �  3. I'm at least partially there with the auto scale, since the major axis labelers will automatically determine the number of decimals to print based on the dynamic range. �I, too, wrote an autoscaler in HP9800 Basic, the listings for which were on thermal paper that decomposed only, harumph, about 35 years ago :-) �The axis labeler code (calculating a Log10 value for the range ('extent' in my code), then adding one major tic axis increment top & bottom, then truncating, should do the trick. All criticism welcome! �Many eyes make all bugs shallow - Eric S. Raymond - Steve Edited 2020-10-18 07:14 by NPHighview Live in the Future. It's Just Starting Now! |
||||
| Sasquatch Guru Joined: 08/05/2020 Location: United StatesPosts: 385 |
Seems to be ok on RC3, I doubt this code has changed in a good long while. �Try "CTU" or "CTV" for the alignment$ parameter, also the parameter is a string so needs to be in double quotes or a string variable. Also the manual under "Text" command has a more complete explanation. Edited 2020-10-18 07:52 by Sasquatch -Carl |
||||
| NPHighview Senior Member Joined: 02/09/2020 Location: United StatesPosts: 221 |
Carl, Peter - I just loaded RC4. Some good news, and some bad news: * Bitmap capture is now "right side up" - thanks! * Various non-default alignments still show really weird results. Here's the code snippet for drawing the left-hand axis label: SUB LabelAxes xl$, yl$ ' draw axis labels TEXT ph_x_min+20, gr_y_ctr, yl$, "LMU", 4, 1, RGB(cyan), -1 ' start just off left edge TEXT gr_x_ctr, (gr_y_min+16)/2, xl$, "CM", 4, 1, RGB(cyan), -1 ' start just above message area END SUB ...and here's the resulting output (the rest of the plot shows up great): 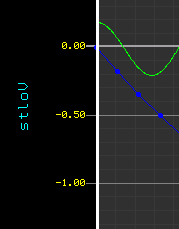 Still seems to me to be an OPTION VERTICAL_AXIS UP issue. Thanks to you both! and to Paul in NY, for whom I've now corrected the LOG10 function, and eliminated all unused declarations. - Steve Live in the Future. It's Just Starting Now! |
||||
| Paul_L Guru Joined: 03/03/2016 Location: United StatesPosts: 769 |
Only FORTRAN (not FORTRAN II) guys always use I and J as integer counters. I myself started out with machine language on the 1401 long before FORTRAN showed up. I usually use NP++ to write my code. Then, after I save the code I leave NP++ running with the file still loaded and switch focus back to the desktop, start MMedit, wait for it to load the file last file it loaded automatically (probably the code I'm working on now), run the format routine, save the program file, close MMedit, and focus back to NP++. NP++ detects that something else has changed the file currently loaded and asks if I want to re-load it. I reply yes please re-load it and it re-loads the now newly formatted file. This routine, save switch focus away from NP++ click start MMedit format save close MMedit switch focus to NP++ re-load newly formatted file takes about 5 seconds and saves a lot of heartache when I screw up some structure. Code that should be at the left margin will be indented after un-closed structures! Paul in NY |
||||
| Tinine Guru Joined: 30/03/2016 Location: United KingdomPosts: 1646 |
I am looking at following this procedure. Are there any more tips/tricks for using MMedit in conjunction with NP++? |
||||
TassyJim Guru Joined: 07/08/2011 Location: AustraliaPosts: 6538 |
Paul's method works well. You can also look at MMEditPlus. Together with the NPP plugins, you can format directly in NPP without having to use MMEdit. (Well, you are using bits of MMEdit behind the scenes) MMUploader will allow you to drag and drop your code from NPP to the Uploader window for instant uploading. I do use that a lot and I am slowly improving it. An earlier post suggested that MMEdit is missing the keyboard shortcuts ctr-Arrow and Shift-arrow. They have been there for many years. My main use for NPP is to search multiple files. Handy when you are looking through C source code trying to find a particular procedure. Jim VK7JH MMedit |
||||
| NPHighview Senior Member Joined: 02/09/2020 Location: United StatesPosts: 221 |
Thanks to all who have commented, and especially Peter, who have helped me improve the quality of the plotter package. Based on his recent RC5, I've updated the Y axis labeling to show vertically (though if the firmware is 5.0505 the plotter package still works, just with the Y axis label horizontal). I've modified the demonstration plots slightly for variey here. This still uses OPTION Y_AXIS UP, but pretty much all of the other OPTIONS are, well, optional  Hopefully, if this fails at all, it fails gracefully. Hopefully, if this fails at all, it fails gracefully.Here's another plot sample: 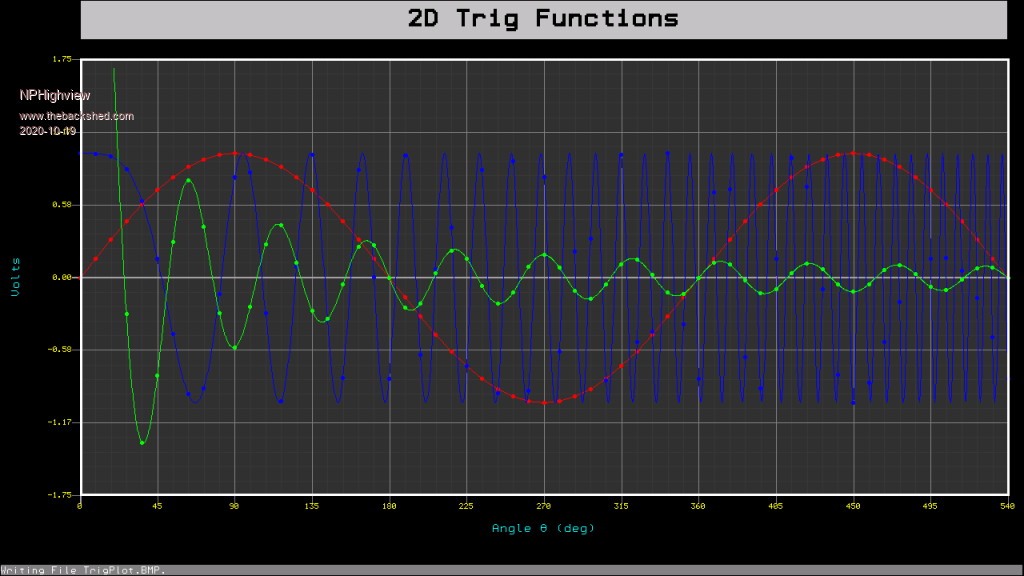 And the current listing (sorry, I've got indents set at 2 spaces): ' plotpkg.bas - HP9800-style plotting on the CMM2 ' ' Steve "NPHighview" Johnson October 2020 ' Please contact me via TheBackShed Forum for any questions ' ' Public Domain - Free / Unrestricted Public Use ' ' This should be relatively display mode-independent. YMMV! ' ' ***************************************************************************** ' Set Up Environment ' ***************************************************************************** OPTION BASE 0 ' my personal practice; not required for plotter package OPTION EXPLICIT ' used for development; not required once debugged DIM FLOAT FirmwareVersion = MM.INFO(version) ' Test prior to OPTION ANGLE, Y_AXIS IF FirmwareVersion < 5.0505 THEN CLS : PRINT "Sorry, this software requires firmware 5.0505 or above." : END OPTION ANGLE DEGREES ' Used by sample plots; not required for plotter package OPTION Y_AXIS UP ' Note upright Bitmap capture requires v.5.0506RC4 and up. ' Vertical orientation of Y axis labels requires v.5.0506 ' but will work around with v.5.0505, just horizontally ' Declarations for Plotter package. Available to, but not required by samples ' Naming Conventions: ' ph: Physical gr: Graph tl: Title Box sc: Scaled ' min: minimum ctr: center max: maximum ext: extent inc: increment DIM INTEGER ph_x_min, ph_x_max, ph_x_ctr, ph_x_ext, ph_y_min, ph_y_max, ph_y_ctr, ph_y_ext DIM INTEGER gr_x_min, gr_x_max, gr_x_ctr, gr_x_ext, gr_y_min, gr_y_max, gr_y_ctr, gr_y_ext DIM INTEGER tl_x_min, tl_x_max, tl_x_ctr, tl_x_ext, tl_y_min, tl_y_max, tl_y_ctr, tl_y_ext DIM FLOAT sc_x, sc_y, last_sc_x, last_sc_y ' Scaled graph parameters. Displays in physical graph area DIM FLOAT sc_x_min, sc_x_ext DIM FLOAT sc_y_min, sc_y_ext DIM INTEGER initial_move = 0 ' A flag that tracks whether a MOVE command preceeded any PLOT command ' Declarations for sample plots - NOT USED in plotter package DIM STRING key$ ' captures user keypresses DIM FLOAT theta, phi, x_3d, y_3d, z_3d, x_2d, y_2d ' ***************************************************************************** ' Define functions and subs ' ***************************************************************************** FUNCTION LOG10(v) as FLOAT ' returns logarithm base 10 of input value IF v <= 0.0 THEN LOG10 = -9.99E19 ELSE LOG10 = log(v)/log(10) END FUNCTION SUB SetPlotParams screenMode, colorDepth ' Establish plot params based on video mode LOCAL STRING Mode_Depth ' Best if used with high-res modes' LOCAL INTEGER vres%, hres% if screenMode < 1 OR screenMode > 13 then EXIT SUB else screenMode = INT(screenMode) if colorDepth < 8 OR colorDepth > 16 then EXIT SUB else colorDepth = INT(colorDepth) if screenMode = 9 AND colorDepth = 12 then colorDepth = 8 ' OK, mode 9 is weird Mode screenMode,colorDepth ' Set video mode and color depth ' Must set the mode to get the resolutions from MM. CLS hres% = MM.hres ' get the actual horizontal resolution from the hardware vres% = MM.vres ' get the actual vertical resolution from the hardware ' Based on screen mode, set all of the plotter parameters ph_x_min = 0 : ph_x_max = hres%-1 : ph_x_ctr = INT(hres%/2) : ph_x_ext = hres% ph_y_min = 0 : ph_y_max = vres%-1 : ph_y_ctr = INT(vres%/2) : ph_y_ext = vres% ' Graph dimensions gr_x_min = 100 ' relatively arbitrary - leaves room for Y axis label and Major Axis values gr_x_max = hres% - 20 ' leaves room on the right. May not be needed gr_x_ext = gr_x_max - gr_x_min gr_x_ctr = gr_x_min + gr_x_ext/2 gr_y_min = 100 ' relatively arbitrary - leaves room for X axis label, tick values and status line gr_y_max = vres% - 75 ' leaves room on top for the graph Title gr_y_ext = gr_y_max - gr_y_min gr_y_ctr = gr_y_min + gr_y_ext/2 ' Title dimensions tl_x_min = gr_x_min tl_x_max = gr_x_max tl_x_ctr = gr_x_ctr tl_x_ext = gr_x_max - gr_x_min tl_y_min = vres% - 50 ' relatively arbitrary - room on top of title. May not be needed tl_y_max = vres% ' a little space between title and graph area tl_y_ext = tl_y_max - tl_y_min tl_y_ctr = tl_y_min + tl_y_ext/2 ' Scaled Operations last_sc_x = 0 last_sc_y = 0 END SUB SUB DrawPlotArea xmin, xmax, ymin, ymax, xjdiv, yjdiv, xndiv, yndiv ' draw background, axes, labels of plot area. LOCAL x, y, xjinc, yjinc, xninc, yninc, xval, yval ' floats. "j" for maJor, "n" for miNor tic marks LOCAL sc_x_e10, sc_y_e10, xval_trnc, yval_trnc ' truncated (base 10) scaled extents and values LOCAL STRING xval_disp, yval_disp ' truncated string values ' Set scaled graph values from parameters passed here. No need to bother user with all this stuff sc_x_min = xmin sc_y_min = ymin sc_x_ext = xmax - xmin ' ext is "extent" sc_y_ext = ymax - ymin sc_x_e10 = 2-FIX(LOG10(ABS(sc_x_ext))) ' calculates the number of digits to display on axis labels sc_y_e10 = 2-FIX(LOG10(ABS(sc_y_ext))) ' calculates the number of digits to display on axis labels xjinc = gr_x_ext/xjdiv ' calculate the physical increment for the maJor divisions yjinc = gr_y_ext/yjdiv xninc = xjinc/xndiv ' calculate the physical increment for the miNor divisions yninc = yjinc/yndiv BOX gr_x_min, gr_y_min, gr_x_ext, gr_y_ext, 1, &H303030, &H303030 ' dark grey background for x = gr_x_min to gr_x_max+1 step xninc ' Minor X Axis tick marks LINE x, gr_y_min, x, gr_y_max, 1, &H383838 ' draw inside the plot box next x for y = gr_y_min to gr_y_max+1 step yninc ' Minor Y Axis tick marks LINE gr_x_min, y, gr_x_max, y, 1, &H383838 ' draw inside the plot box next y xval = xmin for x = gr_x_min to gr_x_max+1 step xjinc ' Major X Axis xval_disp = STR$(xval,0,sc_x_e10) ' Display specified resolution of scaled value xval_trnc = val(xval_disp) ' May result in a value of -0.000 (!!) IF xval_trnc = 0 THEN ' Strangely, -0.00 equates to zero. LINE x, gr_y_min-10, x, gr_y_max, 2, &HA0A0A0 ' Subtly emphasize zero crossing by widening axis line xval_disp = STR$(0,0,sc_x_e10) ' Avoid showing a "-0.00". Show 0 to spec. resolution TEXT x, gr_y_min-10, xval_disp, CT, 7, 1, RGB(yellow), -1 ELSE LINE x, gr_y_min-10, x, gr_y_max, 1, &H808080 TEXT x, gr_y_min-10, xval_disp, CT, 7, 1, RGB(yellow), -1 END IF xval = xval + (xmax-xmin)/xjdiv next x yval = ymin ' Keep track of scaled values for y = gr_y_min to gr_y_max+1 step yjinc ' Major Y Axis yval_disp = STR$(yval,0,sc_y_e10) ' Display specified resolution of scaled value yval_trnc = val(yval_disp) ' May result in a value of -0.00 (!!) IF yval_trnc = 0 THEN ' Strangely, -0.00 equates to zero. LINE gr_x_min-10, y, gr_x_max, y, 2, &HA0A0A0 ' Subtly emphasise zero crossing by widening axis line yval_disp = STR$(0,0,sc_y_e10) ' Avoid showing a "-0.00". Show 0 to spec. resolution Text gr_x_min-10, y, yval_disp, RM, 7, 1, RGB(yellow), -1 ELSE LINE gr_x_min-10, y, gr_x_max, y, 1, &H808080 Text gr_x_min-10, y, yval_disp, RM, 7, 1, RGB(yellow), -1 END IF yval = yval + (ymax-ymin)/yjdiv next y ' draw outline around graph area, on top of tick marks BOX gr_x_min, gr_y_min, gr_x_ext+2,gr_y_ext+2, 3, &HFFFFFF END SUB SUB TitleBox TitleString$ ' draws a graph title centered over the graph area LOCAL INTEGER x%, y% BOX tl_x_min, tl_y_min, tl_x_ext, tl_y_ext, 1, &HC0C0C0, &HC0C0C0 ' box for title string for x% = tl_x_ctr-1 to tl_x_ctr+1 step 2 ' Make the title Bold for y% = tl_y_ctr-1 to tl_y_ctr+1 step 2 TEXT x%, y%, TitleString$, CM,4, 2, &H000000, -1 next y% next x% END Sub SUB LabelAxes xl$, yl$ ' draw axis labels TEXT gr_x_ctr, (gr_y_min+16)/2, xl$, "CM", 4, 1, RGB(cyan), -1 ' start just above message area IF FirmwareVersion > 5.0505 THEN TEXT ph_x_min+20, gr_y_ctr, yl$, "CMU", 4, 1, RGB(cyan), -1 ' vertical, start just off left edge ELSE TEXT ph_x_min+2, gr_y_ctr, yl$, "LM", 4, 1, RGB(cyan), -1 ' horizontal, start just off left edge END IF END SUB SUB Move Plot_x, Plot_y ' Moves (without drawing) the virtual pen. A move must precede the first Plot last_sc_x = Plot_x last_sc_y = Plot_y initial_move = 1 ' set the flag once a move is done END SUB FUNCTION Contained (value, l_bound, u_bound) AS INTEGER ' Range check. Used in clipping the plot IF MIN(l_bound, u_bound) <= value AND value <= MAX(l_bound, u_bound) THEN Contained = 1 ELSE Contained = 0 END FUNCTION SUB Draw Plot_x, Plot_y, Width, PenColor ' Plot with naive clipping. LOCAL INTEGER x1,y1,x2,y2, old_contained, new_contained IF NOT initial_move then EXIT SUB ' requires a move prior to draw x1 = gr_x_min + INT((gr_x_ext * (last_sc_x - sc_x_min) / sc_x_ext)) y1 = gr_y_min + INT((gr_y_ext * (last_sc_y - sc_y_min) / sc_y_ext)) IF Contained(x1, gr_x_min, gr_x_max) AND Contained(y1, gr_y_min, gr_y_max) THEN old_contained = 1 else old_contained = 0 x2 = gr_x_min + INT((gr_x_ext * (Plot_x - sc_x_min) / sc_x_ext)) y2 = gr_y_min + INT((gr_y_ext * (Plot_y - sc_y_min) / sc_y_ext)) IF Contained(x2, gr_x_min, gr_x_max) AND Contained(y2, gr_y_min, gr_y_max) THEN new_contained = 1 else new_contained = 0 ' FOR CLIPPING, we must evaluate whether the new or old coordinates are within the plot area. ' If both new and old are inside the plot area, go ahead and draw the line. IF (old_contained + new_contained) = 2 THEN LINE x1, y1, x2, y2, 1, PenColor ' both are inside. Easy peasy! ' If old and new are both outside the plot area, don't draw the line at all. ' If one is inside and the other is outside (doesn't matter which), don't draw the line at all (for now). ' Later, we'll find the point on the edge that is on the line, draw from the inside point to that point. last_sc_x = Plot_x : last_sc_y = Plot_y ' No matter what, update the last scaled x & y. END SUB SUB Point Plot_x, Plot_y, Diameter, Color ' Plot a dot at the scaled coordinates. Naive clipping. LOCAL INTEGER x1, y1, old_contained, new_contained x1 = gr_x_min + INT((gr_x_ext * (Plot_x - sc_x_min) / sc_x_ext)) y1 = gr_y_min + INT((gr_y_ext * (Plot_y - sc_y_min) / sc_y_ext)) IF Contained(x1,gr_x_min,gr_x_max) AND Contained(y1,gr_y_min,gr_y_max) THEN CIRCLE x1, y1, Diameter, 1, 1, Color, Color last_sc_x = Plot_x last_sc_y = Plot_y initial_move = 1 ' This constitutes an initial move, since last_sc_. are set END SUB SUB DisplayStatus Message$, Color ' Shows a status message at the bottom of the screen. BOX ph_x_min, ph_y_min, ph_x_max, 15, 1, &H808080, &H808080 ' Box for status line TEXT ph_x_min, ph_y_min, Message$, LB, 1, 1, Color, -1 END SUB SUB PauseStatus Message$, Color ' Shows message, then waits one second LOCAL STRING k$ DisplayStatus Message$, Color Timer = 0 : DO WHILE Timer < 1000 : LOOP END Sub SUB WaitStatus Message$, Color ' Shows message, waits for a keypress LOCAL STRING k$ DisplayStatus Message$+" Press any key to continue.", Color Timer = 0 : DO WHILE Timer < 1000 : LOOP k$ = inkey$ : DO WHILE k$ = "" : k$ = inkey$ : LOOP END Sub SUB ClearStatus ' Clears message area BOX ph_x_min, ph_y_min, ph_x_max, 15, 1, &H000000, &H000000 ' Box for status line END SUB SUB PrintScreen Filename$ ' Actually, just saves to .BMP File IF FirmwareVersion < 5.0506 THEN DisplayStatus "Writing File " + Filename$ + ". You will need to flip output vertically", &HFFFF00 ELSE DisplayStatus "Writing File " + Filename$ + ".", &HFFFFFF END IF SAVE IMAGE Filename$ ClearStatus END SUB ' ***************************************************************************** ' Main Program ' ***************************************************************************** ' Example drawing trigonometric functions ' ***************************************************************************** SetPlotParams 11, 16 ' Video mode and color depth. Values combined inside subroutine TitleBox "2D Trig Functions" DrawPlotArea 0, 540, -1.75, 1.75, 12, 6, 5, 5 ' draw axis tick marks. Majors cross; minors inside LabelAxes "Angle "+ CHR$(&HE9) + " (deg)", "Volts" Move 0, SIN(0) ' must Move before a Draw command for theta = 0 to 540 step 9 ' in degrees; dots on minor axis lines Draw theta, SIN(theta), 2, RGB(red) Point theta, SIN(theta), 2, RGB(red) next theta Move 0, COS(0) for theta = 0 to 540 step .5 ' in degrees Draw theta, COS((theta/5)^2), 2, RGB(blue) IF theta/9 = INT(theta/9) THEN Point theta, COS((theta/5)^2), 2, RGB(blue) next theta Move .25, (50*SIN(7*.25)/.25) for theta = .25 to 540 step .25 ' in degrees IF theta <> 0 THEN Draw theta, 50*(SIN(7*theta))/theta, 2, RGB(green) IF theta/9 = INT(theta/9) THEN Point theta, 50*(SIN(7*theta))/theta, 2, RGB(green) next theta BOX gr_x_min, gr_y_min, gr_x_ext+2,gr_y_ext+2, 3, &HFFFFFF ' draw border again to clear up any oopsies' DisplayStatus "[p] print, [q] quit, any other key to continue", &H000000 DO SELECT CASE UCASE$(inkey$) CASE "" : ' do nothing but loop for a keypress CASE "P" : PrintScreen "TrigPlot.BMP" : DisplayStatus "[p] print, [c] continue, [q] quit", &H000000 CASE "Q" : CLS : END CASE ELSE: EXIT DO END SELECT LOOP ' ***************************************************************************** ' 2D color projection of 3D Lissajous ' ***************************************************************************** SetPlotParams 11, 16 ' Video mode and color depth. Values combined inside subroutine DisplayStatus "Please wait while drawing...", &HFFFF00 TitleBox "2D Projected 3D Lissajous Figure with naive clipping" DrawPlotArea -2.0, 2.0, -1.0, 1.0, 8, 4, 5, 5 ' draw axis tick marks. Majors cross; minors inside FOR theta = 0 to 14400 step .125 ' ensures thick coverage of the figure x_3d = SIN(11.1*theta) ' calculate 3D lissajous points y_3d = SIN(11.125*theta) z_3d = COS(11.15*theta) x_2d = x_3d - .7*z_3d ' project them onto a 2D plane y_2d = y_3d - .7*z_3d IF theta=0 THEN Move x_2d, y_2d ELSE Draw x_2D, y_2d, 2, (127*(1-z_3d) + ((127*(1-y_3d)) << 8) + ((127*(1-x_3d)) << 16)) END IF NEXT theta BOX gr_x_min, gr_y_min, gr_x_ext+2,gr_y_ext+2, 3, &HFFFFFF ' draw border again to clear up any oopsies' DisplayStatus "[p] to print, any other key to quit", &H000000 DO SELECT CASE UCASE$(inkey$) CASE "" : ' do nothing but loop for a keypress CASE "P" : PrintScreen "Lissajous.BMP" : DisplayStatus "[p] to print, any other key to quit", &H000000 CASE ELSE: EXIT DO END SELECT LOOP cls end Live in the Future. It's Just Starting Now! |
||||
| The Back Shed's forum code is written, and hosted, in Australia. | © JAQ Software 2026 |
