
|
|
Forum Index : Microcontroller and PC projects : XProf Statistical Profiling for CMM2
| Author | Message | ||||
| epsilon Senior Member Joined: 30/07/2020 Location: BelgiumPosts: 255 |
Many performance sensitive programs have steady states running in a loop, e.g. a game loop. When optimizing such loops for performance, it's important to measure which parts of the loop are actually hogging the CPU. Optimizations can then be targeted to those parts of the code where you'll get the most yield. One way of measuring is by periodically sampling the 'Program Counter' using a timer ISR and the TRACE LIST command. The trace list data can then be organized into a histogram for easy analysis. xprof.inc sets up the periodical trace list logging on the CMM2 side. This is the module you include the program you want to analyze. xprof.py runs on the host. It analyzes the trace list data coming in through the serial port and presents the result in a histogram. An example: ---------- I want to analyze my game loop, GM_run. 1. I insert my xprof hooks in the program: OPTION CONSOLE SERIAL 'Console should be either SERIAL or BOTH' ... #INCLUDE "xprof.inc" ... 'Starting profiling using timer 3 with a period of 39ms xprof_start(3, 39) 'The game loop GM_run 'Stop profiling (optional. Profiling data can be acquired and analyzed before ending the loop) xprof_stop ... 2. I connect the serial port to a host machine and start my program on the CMM2. At this point, if you'd look at the serial port output using a terminal program, you'd see something like this: P:[ObjectList.inc:161] [xprof.inc:23] [xprof.inc:24] <other program output> P:[EventKeyboard.inc:99] [xprof.inc:23] [xprof.inc:24] <other program output> ... 3. But we won't be looking at the serial port with a terminal program. Instead, we run xprof.py: > python xprof.py -p COM7 -b 115200 Data acquisition now starts and continues until we press 'q'. 4. We let it run until we have acquired enough data to get a reasonable picture, e.g. 500 data points. Then we press 'q'. We get the following result: c:\cmm2\xprof>python xprof.py -p COM7 -b 115200 Press 'q' to quit data acquisition. Acquired 550 datapoints. DisplayManager.inc:[30-39]: 13 :*** DisplayManager.inc:[40-49]: 83 :******************** Event.inc:[20-29]: 0 : EventKeyboard.inc:[90-99]: 1 : InputManager.inc:[130-139]: 2 : InputManager.inc:[140-149]: 1 : Object.inc:[100-109]: 10 :** Object.inc:[110-119]: 3 : Object.inc:[120-129]: 2 : ObjectList.inc:[90-99]: 6 :* ObjectList.inc:[130-139]: 53 :************ ObjectList.inc:[160-169]: 1 : ObjectListIterator.inc:[10-19]: 1 : ObjectListIterator.inc:[20-29]: 34 :******** ObjectListIterator.inc:[30-39]: 39 :********* ObjectListIterator.inc:[40-49]: 0 : Vector.inc:[10-19]: 1 : WorldManager.inc:[100-109]: 4 : The output shows that most time is spent in Displaymanager.inc lines 40-49, and in ObjectList.inc lines 90-99. That's where I should focus my optimizations on. Configuration: ------------- On the CMM2 side, when starting profiling, a timer_id and a timer period should be specified. Any free timer will do. The period value might require some experimentation. It should not be equal to the period of the loop you're profiling, or you'll fall into a beat pattern. For the same reason you should also avoid any harmonics of the loop period. Very short periods should also be avoided because the profiling overhead would get very large. On the host side, next to the serial port and baudrate, you can pass in a binwidth. That's the width of one bin in the histogram. The default value is 10 MMBasic lines. Required Python version ----------------------- 3.x You also need to install the pySerial module: pip install pyserial GitHub ------ https://github.com/epsilon537/xprof_cmm2 Limitations ----------- The Python module was only tested on Windows 10. I'm not aware of any specific platform dependencies in the code, so it might just work on MacOSX and Linux as well. Cheers, Ruben/Epsilon. xprof.zip Epsilon CMM2 projects |
||||
| thwill Guru Joined: 16/09/2019 Location: United KingdomPosts: 4369 |
Nice. I'm correct in thinking this won't work for profiling programs that are intended to send their output to the serial terminal aren't I ?  Another demonstration of why it would be useful if there were some way of redirecting output from commands such as LS, TRACE, etc. to files or other COM ports. Best wishes, Tom MMBasic for Linux, Game*Mite, CMM2 Welcome Tape, Creaky old text adventures |
||||
| epsilon Senior Member Joined: 30/07/2020 Location: BelgiumPosts: 255 |
The Python program will filter out just the profiling lines, so it's OK if there's other text on the terminal. You won't be able to see it though because you can't run a terminal program on the same port while xprof.py is running (unless you're doing some Linux wizardry with pipes and 'tee' perhaps). One easy change I could make is to optionally have the Python program print the non-profiling text lines during data acquisition, so you can still see your original program output. Epsilon CMM2 projects |
||||
| thwill Guru Joined: 16/09/2019 Location: United KingdomPosts: 4369 |
Please don't do that for my sake. Best wishes, Tom Edited 2021-01-22 01:58 by thwill MMBasic for Linux, Game*Mite, CMM2 Welcome Tape, Creaky old text adventures |
||||
| matherp Guru Joined: 11/12/2012 Location: United KingdomPosts: 11499 |
Watch this space - coming tomorrow a full profiling capability for the CMM2 in V5.07.00b6 The attached shows for each line of a program the number of times a particular line has been run and the average time in uSec that each time took to run. The text is the program line as it really exists in memory after the crunch that the CMM2 applies except that the single byte command and function tokens are expanded to make it readable. The overhead of enabling real-time profiling is about 5% 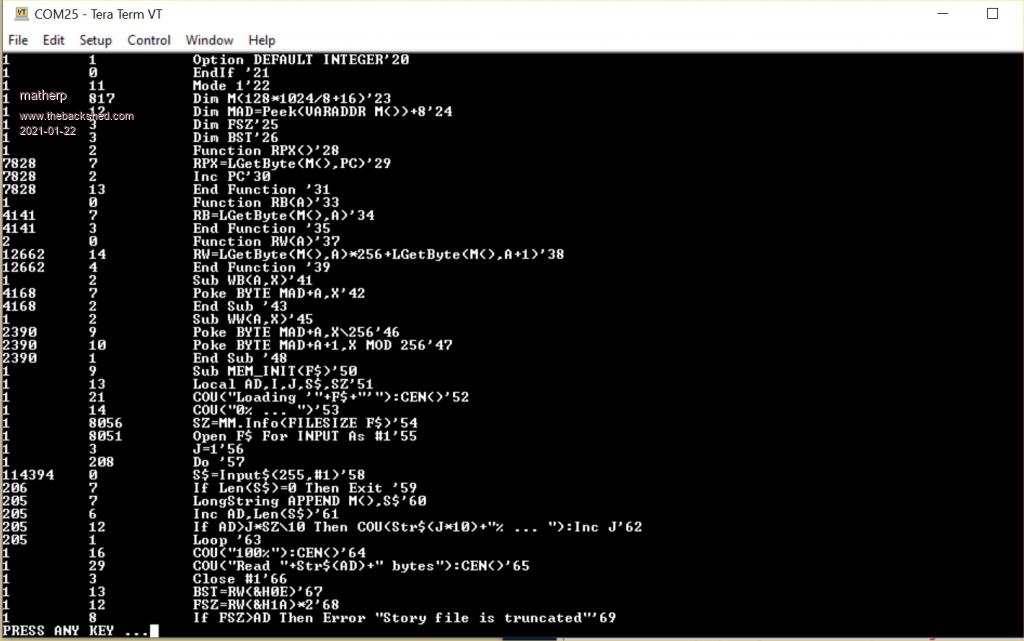 Edited 2021-01-22 05:43 by matherp |
||||
| thwill Guru Joined: 16/09/2019 Location: United KingdomPosts: 4369 |
Insane  I thought you had been quiet for a while Peter. I thought you had been quiet for a while Peter.Best wishes, Tom MMBasic for Linux, Game*Mite, CMM2 Welcome Tape, Creaky old text adventures |
||||
CircuitGizmos Guru Joined: 08/09/2011 Location: United StatesPosts: 1427 |
As you load a program from the SD into the CMM2, can you make an index table (in RAM or SD?) that you would, in showing the profile output be able to get back to the source line number? This wouldn't be done always, just when profiling enabled. Micromites and Maximites! - Beginning Maximite |
||||
| matherp Guru Joined: 11/12/2012 Location: United KingdomPosts: 11499 |
The source line number is the number in the comment |
||||
| CircuitGizmos Guru Joined: 08/09/2011 Location: United StatesPosts: 1427 |
Oh! I was confused. When you said "The text is the program line as it really exists in memory after the crunch" I was thinking that visible source looked different. Got it - 'nuff said! Micromites and Maximites! - Beginning Maximite |
||||
| mkopack73 Senior Member Joined: 03/07/2020 Location: United StatesPosts: 261 |
Very cool stuff! And very useful as well! |
||||
| The Back Shed's forum code is written, and hosted, in Australia. | © JAQ Software 2026 |
