
|
|
Forum Index : Microcontroller and PC projects : [CMM2/RetroMax] GRAPHICS: Translation of Cartesian Axes
| Author | Message | ||||
| horus Newbie Joined: 25/04/2021 Location: United StatesPosts: 12 |
Howdy, Folks, I'm chugging along, writing a program that uses a 3-dimensional Cartesian coordinate system displayed as a 2D map with the Z-coordinate shown as a number by each point. (Yeah, it's a simplification so I don't have to deal with translating a z-axis...) In my program, I'm using a map space 500 pixels wide and 500 pixels deep which starts at screen coordinates 100,100 to represent a set of scaled coordinate axes in a Cartesian plane that is 50 units in scaled length extending from each side of the Origin (scaled coordinates (0,0,0)), or 100 scaled units square. Attempting to visualize and code for this in my head turned what remains of my brain cell inventory into oatmeal mush in short order, so I resorted (as I always do in such situations) to the use of a spreadsheet to noodle out the needed translations. Translating the X axis is relatively easy (deceptively so), but I wanted a more generalized solution, and the Y axis more or less drove the search. Why was this true, one might ask? Because the Y axis, in addition to needing to be scaled also needed to be rotated 180 degrees (or so I thought at the time... there's a simpler dodge for this, though). Playing around with the spreadsheet, I came up with a set of simple equations to accomplish the needed translations that I thought might be useful, or at least stimulate some useful discussion. Instead of dragging you all through the entirety of my stream of consciousness, here are the general equations I derived to translate the axes. Here we go: X_displayed = (X_scaled - X_offset)*(Scale_Factor) + (X_disp_map_center) Y_displayed = (Y_scaled - Y_offset)*(-Scale_Factor) + (Y_disp_map_center) The -Scale_Factor is needful for the Y-axis because the raw Y-axis becomes more positive the further down the display it goes, while a Cartesian Y-axis becomes more negative moving in that same direction. This simple difference eliminated the need for more complicated matrix operations that would have otherwise accomplished a 180 degree rotation of the Y-axis to reconcile this difference. (Hey, I fell asleep in Linear Algebra class because I was seated next to the radiator... but I digress.) The constants X_offset and Y_offset are needed to account for any further translation to areas outside the original map space. For the given map space, the offsets are both zero. My spreadsheet is not uploadable here, and probably wouldn't make much sense to anyone but me, anyway. EDIT: Silly me: Google Drive is good for times like this. Spreadsheet HERE... Has anyone else faced a similar problem and resolved it more simply? Edited 2021-05-24 09:04 by horus |
||||
| Volhout Guru Joined: 05/03/2018 Location: NetherlandsPosts: 5930 |
Hi Horus, To me it is not entirely clear what you want to establish. In your excel sheet I see no Z axis, only linear conversions of X and Y. If you need to represent 3 dimensional data in excel, excel has graph formats for it. If you want to represent 3 dimensional data in MMBasic, you'll have to do some conversion like : Xscreen = k1*Xdata + k2*Ydata + k3*Zdata Yscreen = k4*Xdata + k5*Ydata + k6*Zdata For fancier graphs like the Excel graphs, there is more calculation required. 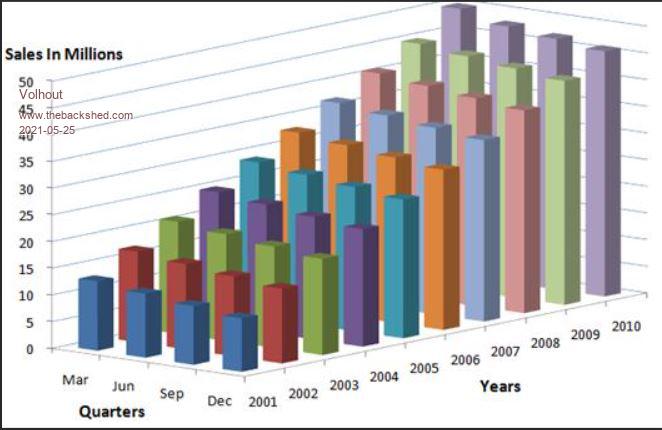 PicomiteVGA PETSCII ROBOTS |
||||
| horus Newbie Joined: 25/04/2021 Location: United StatesPosts: 12 |
Hi, Volhout, Yeah, I mention in the first paragraph that I'm only showing the z-axis as a number next to each plotted point. It's a simplification, but is adequate to my purposes. I won't be doing any graphing except to plot points and maybe draw some lines connecting them. Once I understand the 3d system in MMBasic better I might go back and do something that's actually 3D. (I'm still learning the differences between MMBasic and all the other BASICs I used to play with back in the day.) I only used LibreOffice Calc to help me work out the equations for translating the axes for display in the space defined for it. (I warned that it might not make sense to anyone but me...) The general equations developed from my tinkerings was what I was looking for feedback on, mainly seeking a better way to accomplish derivation than the admittedly "brute force" method I've employed here. The thing that had me trippin' the hardest was the Y-axis, since in graphics space it is inverted (or rotated 180 degrees) from the usual Cartesian Y-axis, but I think I noodled out how to do that without resorting to any Linear Algebra. I'll have to give your much more generalized equations a closer look. Thanks! Edited 2021-05-26 02:57 by horus |
||||
| The Back Shed's forum code is written, and hosted, in Australia. | © JAQ Software 2026 |
