
|
|
Forum Index : Microcontroller and PC projects : Elementary plot routine CMM2
| Author | Message | ||||
| Volhout Guru Joined: 05/03/2018 Location: NetherlandsPosts: 5927 |
As suggested by Tom, I started to write a universal plot routine for data in arrays. This is the first level, it plots X/Y data from array. I plan to expand it to support multiple lines. The plot.inc file contains a function that you can call from the main, with an array as variable. When no other variables are given the plot routine examines the array to determine the size of the array, ranges to data and plots full screen. Additional parameters can be handed to the function, such as the part of the array that must be plotted, and where on screen the plot must be placed, and what size. The code: plot.inc 'this file contains plot functions function plot(a(),ax,ay,px,py,sx,sy) 'find the array dimensions if omitted 'by incrementing pointers until an error occurs if ax=0 then do ax=ax+1 on error skip dummy=a(ax,1) loop while MM.ERRNO=0 ax=ax-1 end if if ay=0 then do ay=ay+1 on error skip dummy=a(1,ay) loop while MM.ERRNO=0 ay=ay-1 end if 'if no plot coordinates are provided assume full screen if px=0 and sx=0 then sx=MM.HRES if py=0 and sy=0 then sy=MM.VRES 'print ax,ay,px,py,sx,sy 'plot outline box px,py,sx,sy 'slice array in separate arrays, assume minimal X Y local float a1(ay),a2(ay) math slice a(),1,,a1() math slice a(),2,,a2() 'if ax=3 then ' local float a3(ay) ' math slice a(),3,,a3() 'end if 'if ax=4 then ' local float a4(ay) ' math slice a(),4,,a4() 'end if 'find extremes in input data local float max1,max2,min1,min2,gainx,gainy,offsetx,offsety,i max1=math(max a1()):min1=math(min a1()) max2=math(max a2()):min2=math(min a2()) gainx=(sx-1)/(max1-min1) offsetx=int(px-gainx*min1) gainy=(sy-1)/(min2-max2) offsety=int(py-gainy*max2) 'print max1,min1,max2,min2,gainx,offsetx,gainy,offsety 'plot zero axis line offsetx,py,offsetx,py+sy,,rgb(grey) line px,offsety,px+sx,offsety,,rgb(grey) 'calculate ticks, multiply and divide until value between 1-10 local float range,tickrange,tickval,tick,k range=(max1-min1)/1e12 do:range=range*10:loop until range>4 tickrange=int(sx*int(range)/range) tickval=(max1-min1)/range tick=tickrange/int(range) for k=1 to int(range) 'line px+k*tick,offsety-(sy/50),px+k*tick,offsety+(sy/50),,rgb(grey) 'text px+k*tick,offsety+(sy/50),str$(tickval*k),"CTD",,,rgb(grey) line px+k*tick,py,px+k*tick,py+(sy/50),,rgb(grey) line px+k*tick,py+sy,px+k*tick,py+sy-(sy/50),,rgb(grey) if (k mod 2)=0 then tickval=(k/range)*(max1-min1) text px+k*tick,py+(sy/50),str$(tickval,1,-1),"CTD",7,,rgb(blue) end if next k range=(max2-min2)/1e12 do:range=range*10:loop until range>4 tickrange=int(sy*int(range)/range) tick=tickrange/int(range) for k=1 to int(range) line px,py+k*tick,px+(sx/50),py+k*tick,,rgb(grey) line px+sx,py+k*tick,px+sx-(sx/50),py+k*tick,,rgb(grey) if (k mod 2)=0 then tickval=max2-(k/range)*(max2-min2) text px+(sx/50),py+k*tick,str$(tickval,1,-1),"LM",7,,rgb(blue) endif next k 'scale a() to plot window math scale a1(),gainx,a1() math scale a2(),gainy,a2() math add a1(),offsetx,a1() math add a2(),offsety,a2() 'plot the actual graph for i=1 to ay-1 line a1(i),a2(i),a1(i+1),a2(i+1),,rgb(yellow) next i plot=1 end function How to call the function: test_plot.bas 'test program for development of a generic plot routine option base 1 dim integer i,x=2,y=200 dim float sinewave(x,y) #include "plot" for i=1 to y sinewave(1,i)=(i-1)/10 sinewave(2,i)=sin((i-1)/10) next i 'result=plot(sinewave(),,,100,100,400,300) result=plot(sinewave()) 'save image "sineplot" do:loop until inkey$<>"" end This is what it looks like at the moment... 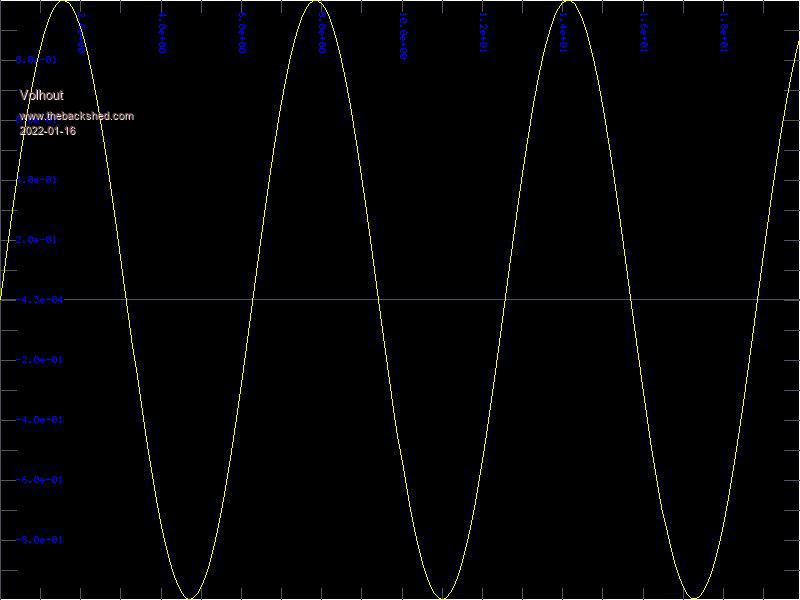 Edited 2022-01-16 01:51 by Volhout PicomiteVGA PETSCII ROBOTS |
||||
| vegipete Guru Joined: 29/01/2013 Location: CanadaPosts: 1179 |
This gets me to pondering the PIXEL, LINE and POLYGON commands on the CMM2. Only the POLYGON command accepts arrays, and it only draws closed polygons. Imagine the possibilities if PIXEL and LINE also accepted arrays... Visit Vegipete's *Mite Library for cool programs. |
||||
| matherp Guru Joined: 11/12/2012 Location: United KingdomPosts: 11499 |
They do. From the manual And so do they on the PicoMite, Armmites, and MMX Edited 2022-01-16 05:19 by matherp |
||||
| Mixtel90 Guru Joined: 05/10/2019 Location: United KingdomPosts: 8904 |
arr() - obviously written on "talk like a pirate" day. :) Mick Zilog Inside! nascom.info for Nascom & Gemini Preliminary MMBasic docs & my PCB designs |
||||
| Volhout Guru Joined: 05/03/2018 Location: NetherlandsPosts: 5927 |
I did not know line could draw coordinates from an array. I'll try if i can make use of it. I had to split the 2d array into two linear arrays to allow for different gain and offset to map to the plot window. But maybe that can be done smarter. Never to old to learn... PicomiteVGA PETSCII ROBOTS |
||||
| Kabron Regular Member Joined: 30/11/2017 Location: GermanyPosts: 65 |
run "testplot.bas" [7] #include "plot" Error : Invalid character: # |
||||
| Kabron Regular Member Joined: 30/11/2017 Location: GermanyPosts: 65 |
Sorry, I tryed with picomite |
||||
| The Back Shed's forum code is written, and hosted, in Australia. | © JAQ Software 2026 |
