
|
|
Forum Index : Electronics : Just what to log
| Author | Message | ||||
| Gizmo Admin Group Joined: 05/06/2004 Location: AustraliaPosts: 5036 |
Hi Pete, could a better aerial work instead of a better transciever? There's a lot of info on the internet about extending the range of these wireless modules using home made aerials, or mounting the standard aerial in a tin can or cooking bowl. I once made a yagi aerial for my NextG connection that worked a treat! I suggest sticking with the cheaper chip, if it works on over short distances, and then leave it up to the reader to add a better aerial if they want more range. Glenn The best time to plant a tree was twenty years ago, the second best time is right now. JAQ |
||||
powerednut Senior Member Joined: 09/12/2009 Location: AustraliaPosts: 221 |
Would the radio modules sold by futurlec be of use? no idea about quality/usability etc http://www.futurlec.com.au/RadioModules.jsp I know they are very slow to deliver orders. |
||||
Downwind Guru Joined: 09/09/2009 Location: AustraliaPosts: 2333 |
Powerednut, Thanks for the link, i am using the more basic modules they list at the moment but see some there are worth a better look into as might be the answer for around the same price. Glenn i had tried different aerials and got better results but do one really want a christmas tree sitting around their lounge room 24/7 to receive data. The other thing i found is some A-hole around here must have a big transmitter and the larger aerial picks up the wave and it killed 2 transmitters and the micros as well so i went back to a whip aerial and no more problems with dead chips. Pete. Sometimes it just works |
||||
SSW_squall Senior Member Joined: 20/03/2010 Location: AustraliaPosts: 111 |
Couple of idea's suggestions I think it's far easier and more accurate to measure and log DC power rather than AC. Although a logger with an AC input that could be used to count the zero crossings would be useful as this gives RPM of the turbine which would be useful to know. I agree with the comments about the PC, being a good common denominator for data logging A cable is a hell of alot more reliable than any sort of wireless data system!? My suggestion, would be: Use a current shunt, with one of those Maxim high side current sense amplifiers IC's. Use a PIC to sample the current, sample the voltage though a suitable voltage divider, calculate the power and average a few measurements over a second. Also count zero crossings on an AC input for RPM info. Echo that power and RPM info as serial data at 9600baud down a cable with an optocoupler to provide electrical isolation from the PC. Log incoming serial data on PC... The PIC plus signal processing IC's could siphon off some power from the source being logged, with a super cap connected to the power supply of the micro it would have some ride through time. Any gaps in the data would then be, by definition zero output. Shouldn't be too complicated, a couple of IC's and a handful of passives... AB Einstein: Everything should be made as simple as possible, but not one bit simpler |
||||
| Downwind Guru Joined: 09/09/2009 Location: AustraliaPosts: 2333 |
Sounds easy, now you just need to build it and get it on the forum. What you have discribed is very simiular to Gizmos Piclog with a few changes. Goes to show Glenn got a pretty good base design together way back, thats hard to improve on in many ways. Just bare in mind the logger will need to cope with 12 to 56 volt systems at various amp output quanities. Dc is better in many ways to monitor as it will work with solar as well. But it cant be used to monitor household consumption on the mains side. There is advantages and disadvantages which ever way you go about it. Its a matter of picking a point you stop at or it becomes a monster to hard for the average tinker to construct. The problem with using a PIC is you need the extra gear like a programmer board etc to program the little buggers and then can others deal with the source code. I would like to see you put a project together for on the forum. It would be good to give more options to people and show different ways of going about things in circuit to acheive results. Pete. Sometimes it just works |
||||
| Downwind Guru Joined: 09/09/2009 Location: AustraliaPosts: 2333 |
Logger progress report With some further testing of the circuit by Gordon and myself we identified some minor problems that has taken some time to implicate a solution for, that involved many hours staring at wave forms on a cro to get it sorted, followed by a redesign on a already crammed little board to accommodate the changes. I was aware of the low input voltage of the LM-7805 Vreg and it not suiting use in a 48v system so the reg has been upgraded to a 125v input capable HV-reg. ( TL-783 ) Problem 2 was a little harder, and resulted from using the CT for the RPM. No problem with it working, but it would only record RPM once current was flowing through the phase wires. Meaning any RPM before the batteries reached cut in voltage was not recorded as the CT will only produce an output when current is flowing through it and not before hand. A design change was made to take RPM direct from a phase wire through a simple circuit so RPM can be read regardless of current flow. This then set a problem of sync with the amp readings for use with monitoring mains voltage if used as a consumption recorder. I added a 3 pin header so either mill RPM or mains Hz could be selected as a input sync and /or RPM or Hz reading by moving a jumper on the 3 pins. With the addition of a phase sensor wire it has made this a 5 wire system from the previous 4 wire logger. The extra wire is optional and will only give mill RPM below cut in. I tested having the CT wired through a length of wire 20m long (what i had on a roll at the time) and got a change of 0.02 in the reading. This would imply the CT can be mounted some distance from the monitoring circuit and function quite well. Any loss in signal over distance can be compensated for in calibration. Gordon's developments of the on screen software is progressing well and is easy to use. The displaying of graphs for recorded data is easy with some good user friendly functions. Gizmo's on screen display has been retained with changes made to the graphing window and setup, along with some data error checking included. At this point the software is still backwards compatible With Glenn's PicLog but not forward compatible. For a basic simple little circuit i am happy with the performance and the changes made thus far. It was never intended as a high end logger but rather a cost effective recording device that anyone with a ability to solder a few components in the right spot can construct. Pete. 
Sometimes it just works |
||||
| GWatPE Senior Member Joined: 01/09/2006 Location: AustraliaPosts: 2127 |
Logger software. The differing requirements of this logging unit has dictated that a separate program will be required for the windmill logging application to the RE house logging application. As part of the development process, I am including a data, error logging function, in addition to the data logging function. This is to allow some useful feedback, should problems be experienced. Interactions with the real world, and a computer, can sometimes produce unpredictable results. The process of capturing data, that could corrupt the data set, or worse disrupt the logging process is unfortunately a slow one. I am now resorting to brute force tactics, to test how the error checking, and recovery routines function. I will attempt to replicate all scenarios, so a robust software tool is available, before it is released. Gordon. become more energy aware |
||||
| GWatPE Senior Member Joined: 01/09/2006 Location: AustraliaPosts: 2127 |
I have pretty well finished stage one. This is a revamp PicLog program, that now will be available as a self installing package, that will create all the necessary files, and folders, as well as a place on the "Windows" start bar menu system. This is a PC only application. The program in testing allows interactive selection of the logging port, the baud rate and system voltage. The program can recover the logging function following a change in baud rate, port, serial cable disconnection, and many forms of COMM errors. I have also improved the Excel data file generation to place the files in the Excel folder, instead of with the raw log files. The Zoom within Zoom has been enhanced, to avoid the need for a Display refresh between Zooming. The program creates the Excel and logs and html folders, if they don't exist. There will be a few more days of Beta testing. This will be a supplement to the original Piclog, so existing users will only need to copy their existing log files into the new logs folder, and these can be viewed and processed in the new program. Logged Files created with the new program are not backward compatible though, due to the file naming convention now adopted to place logged files in chronological order. Edit: The file was available for testing but is now on hold. it would be grateful if The readers whom have already downloaded, would be able to provide some feedback. There still may be some bugs, and I have an error log system, should it be needed. Interest would be approciated before a version is released in an article. I am allowing a short period for some comments. It would be best to use the forum for this. Gordon. become more energy aware |
||||
| GWatPE Senior Member Joined: 01/09/2006 Location: AustraliaPosts: 2127 |
Well, I can see by the enthusiastic responses that there is little interest in what is being offered. Readers must have better systems that they are not prepared to share info on, on this forum. This piclog is now in the form of a self extracting file, and requires little computer skills to get a working logger, with data graphing. I can only assume that if readers don't have a better logging system, that they don't place much importance on logging. I can say, that there are many large, expensive, commercially installed Off grid RE setups, that are coming to the end of the installer warranty period, that will need battery replacement. These are 1000-1500Ah 48V systems, with top shelf batteries. If these systems had some data logging, then deficiencies in the system, either solar RE, or windmill RE capaqcity, or Genset function, or battery performance, or load profile would be be picked up. We are talking about a low cost logging system to gather data to protect a high cost investment. I can only deduce that readers do not fit into this RE setup category, and do not have any significant investment that is worth monitoring. I do know that if an RE system is monitored for the first year, or even month, that problems to supply the loading, and battery recharging performance, that may have drastic long term impact on component life will be evident. I hope that at least current users of a piclog, would be able to make some comments. I will stop now before this becomes a RaNT. Gordon. become more energy aware |
||||
| VK4AYQ Guru Joined: 02/12/2009 Location: AustraliaPosts: 2539 |
Hi Gordon Don't be to disappointed if we are a bit slow on the uptake with this as it stretches our heads to infinity just to get our heads around it. I am slow and still waiting for the parts to put it together and am as good at code a marine turtle climbing a tree. So keep up the good work and don't let slow idiots like me put you off. I think it is a terrific project and hope to get it working in the near future as I am putting a number of mills up and would love to monitor them at the same time to check blade performance and power out to get the best combination. All the best Bob Foolin Around |
||||
| Downwind Guru Joined: 09/09/2009 Location: AustraliaPosts: 2333 |
I understand how frustrating it can be after you put all the time and work into something for the benefit of others to get little response or feed back. I have found the same with the logger circuit board as well, but i am not going to give up and will see this project through. With the hope that some will find the inspiration to give it a go, and then realize just how powerful of a little tool it really is. To be able to sit back inside and review the day, weeks or even years performance of your mill that you spent the time to create is a very rewarding result. It allows you to see exactly what any modifications or adjustments have made to the operation of the mill, and what further adjustments are needed. As Gordon has said on the battery side alone it will indicate maintenance pending, and show over all battery performance. This is not a daunting project, as between Gordon and myself we have endeavored to make this as easy as possible with self extracting software with almost auto logging, along with simple easy to construct circuitry. There is really no programming or code required as the picaxe will be supplied pre programmed and other than making changes to add extras there is nothing to program. All calibrations are done on the computer screen in the calibration window. Its as simple as clicking a mouse and typing a number in a box. I was once a little reserved to having a go at logging to a computer with Gizmos logger, and once i tried it, found it only to easy. Now we have taken his work a step forward and made it even easier with more built in functions and more stable. Along with a circuit to suit that will be available in a kit form, so there is no problem accessing all the parts required or needing to producing a circuit board. It should work on any windows based computer either through serial or USB. I hope to have all the data together by next week to post on the circuit side of the project, as the circuit is finished and just need to compile the information to post to the forum in a article form. Pete. Sometimes it just works |
||||
| SSW_squall Senior Member Joined: 20/03/2010 Location: AustraliaPosts: 111 |
Hi Gordon, I have been following this thread with some interest, as when i get my RE rig working i will be looking to meter the power in and out of the battery for the totaly ledgitimate reasons that you have covered already. The "WATTS UP" meters look good but have no means to export any data collected. I bought some MAX4080TSA+ high side current sense amplifier IC's and a precision 50mOhm current shunt while ago becuase i though i'd be designing a MPPT controller for my hydro rig before i decided to upgrade to a F&P unit. So i want to use these IC's to create a simple logger like the one you've got together. Absolute max Voltage is 80v on this IC so it should be OK for 48v systems. My thought is to hook this up to a PIC (16F690) with an 2x16 LCD that can display current, voltage, power, and accumulated watts and peak values. I have various assembly language routines that greatly simplify the interfacing the PIC to the LCD. Also echo this data to the serial port at 9600bps I will get round to it in due course, time has been in short supply lately... AB Einstein: Everything should be made as simple as possible, but not one bit simpler |
||||
| Tinker Guru Joined: 07/11/2007 Location: AustraliaPosts: 1904 |
Data logging would be nice to have but... Its a new thing for me so I tend to read up & listen to others before jumping in at the deep end. There are still a few other projects demanding priority so logging keeps moving down the list. There is a 3 month sailing trip coming up end of May, not enough time to start yet another project. Downwind, I'll take my laptop & your little picaxe board with me, just in case I'll get bored watching the sun setting over stunning Kimberley coastal scenery  , to get my head around this programming lark , to get my head around this programming lark  . . Klaus |
||||
| Downwind Guru Joined: 09/09/2009 Location: AustraliaPosts: 2333 |
Tinker, 3 months saling sounds like a lot of time confined to quaters. I be taking my soldering iron and kit as well. Just be careful you dont send a distress signal from those flashing leds, that gets picked up by some satalite when you are miles from nowhere, as you might end up with the RANF watching the sunset with you.
3 months? you would almost qualify for boat people on your return. 
I will look forward to a list of program routines when you get back. (thats if they dont seize your laptop on Christmas island) Pete. Sometimes it just works |
||||
| GWatPE Senior Member Joined: 01/09/2006 Location: AustraliaPosts: 2127 |
Hi Bob, I have been down this long road with my own RE monitoring, and I now realize that priority should have been given to a logging system, before I actually made any windmill, or solar investment. Hi AB, There are units commercially available to do just what you want, and I have several. LCD's are not a problem with a micro, as I have a 20x2 line LCD on my first attempt micro, pre picaxe, before I found a WattsUp meter, and Astro power meters. The DPM logging I have for my electric models is also useful. Long term logging is the problem, and this aspect has been the most challenging. There are commercial OMRON units, self contained with display and memory, with a suitable price tag. Small hall effect sensors are available from "little bird" 30A under $10. direct micro connection, and high or low side current sensing. Hi Pete, I guess time will allow others to provide some more feedback, so I should wait some more. My own efforts are not wasted as others in my personal network are already benefiting from my own research. Reliable, specific long term logging has potential in development as well as future monitoring. It should not be just of as "I wonder how well my system is going. Perhaps I need to log and see?" Gordon. become more energy aware |
||||
| VK4AYQ Guru Joined: 02/12/2009 Location: AustraliaPosts: 2539 |
Hi Gordon We all jump in where angels fear to tread and in a way that is good because we have the opportunity to innovate even by accident. One thing I have noticed are the varying results from various members using the same base equipment, that includes myself as the tests I have done vary significantly from others results, I think that the logger gives the opportunity to use a standard recording device to standardize test results. The static testing of equipment in jigs or lathe is catered for, and all we need is to record temp and wind speed to compare blade performance to power output for a performance package. Top marks for the development and I look forward to getting mine going, keep up the good work that you and Peter are doing on behalf of us all. If I ever get any wind up here I will be able to give you some feedback. All the best Bob Foolin Around |
||||
| GWatPE Senior Member Joined: 01/09/2006 Location: AustraliaPosts: 2127 |
I have to add that this hardware component is purely a DC voltage sensor, an AC current sensor and an AC voltage sensor, with a spare port. There would be different logging apps for say a replacement piclog windmill app, and say an app for monitoring the performance of an RE home, battery and loading. You do not need a windmill. If you have AC power in your home, you can monitor it. You can monitor how much power your AC coupled solar is making for a lot lower cost than a manufacturers option. You could even monitor your fridge, or TV etc. Depending on the house wiring, an electrician may need to be consulted. An Electrician could incorporate the AC current sensor into a short AC extension lead, for appliance monitoring. I am looking at an app that allows the logging channel names and functions to be customized, with a more complex hardware component. This will be a daunting project. Gordon. become more energy aware |
||||
| brucedownunder2 Guru Joined: 14/09/2005 Location: AustraliaPosts: 1548 |
I have the house power consumption meter supplied by the Qld Govt. for $50. They changed all the lightbulbs to CFl's did an audit ,advised what I could do to lower the consumption and gave me this 3 Phase meter. It works by the current sensors at the meter ,(3) and a transmitter. Inside the house we have the metering unit . usage,costing and loads can be viewed ,along with alarms. and logging. Not a bad little unit.. Bruce Bushboy |
||||
| GWatPE Senior Member Joined: 01/09/2006 Location: AustraliaPosts: 2127 |
Hi Bruce, Are you able to show some graphs of the data obtained from the logging you mention on this meter for, say last Friday. You may want to show say the maximum power on each of the sensors, and at what time it occurred for example. If you can, it would be interesting to show say for a 1 hour period, a graph of an interesting period of import, or export power. Here are some graphs I recorded with this new logger app. The first is the inverter load to the house, and Terminal voltage of the Lithium Battery for the whole of Friday. 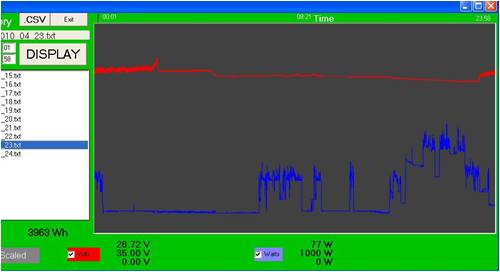
The next is a graph of a portion of this day from 5:30pm till 8:00pm. During this time, the battery was discharged approx 40%, and there was 0.67kW used. The max consumption was 490W, and the minimum was 77W. The battery terminal voltage fell from 26.6V down to 26.0V during this time. 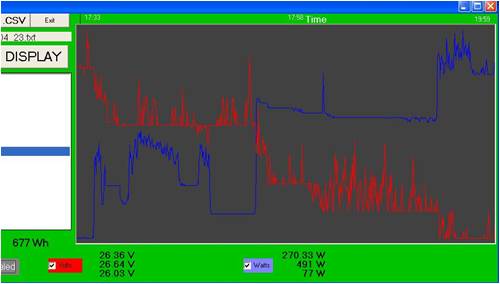
This sort of data on a full sized home RE setup is invaluable. The key to logging is a rapid viewing of the logged data. I think that a point and click viewing of the data is applicable. The totalling system works for someone who is using it for billing purposes, but really something beyond a trending record is required. I have more thoughts on a daily total separate log, so yearly comparisons could also be done. I have a rudimentary implimentation , but this I hope to improve. Gordon. become more energy aware |
||||
| GWatPE Senior Member Joined: 01/09/2006 Location: AustraliaPosts: 2127 |
PS Edit : I have reloaded my revised piclog self extracting program and there are still some bugs, so an update will need to wait a bit. PS Edit end. The program is relatively easy to install. During the install, some files may be in use. Choose ignore, and then OK. The application will be installed, with access in the normal manner through the start menu. There will be a new added menu called piclog2010 in the programs menu. There will be new icons, piclog2010, piclog folder, and a readme. The readme will explain the steps needed to convert the piclog folder in to a folder icon from the program icon that is made with the self installer. All the necessary folders are created, and as long as the COMM port is known, then the setup can be configured with the port number, and system voltage, and baud rate, etc. The default port is 2. If you do not know the port number, and the program is run and seems like there is an endless loop when the exit cross is clicked, then just click the ABORT button in the setup window. This will set the port to zero, and allow the program to be exited normally. Once a valid COMM port is entered, the program can be run normally. Whenever an error is encountered, a record will be updated in an errorlog.txt file. The main display window will show the latest error message, and the latest COMM data. The COMM data is cleared when data is stored to disk. The window is reasonably self explanatory, and the COMM and error windows can be covered by unchecking the COMM box. At the end of each day, and whenever the exit button is clicked, the accumulated Whours at the time is recorded in a whours.txt file located in the logs folder. After continuous long unattended logging [possibly after a year or more], it would be possible to view this data graphically after suitable manipulation in Excel, to show a graphical daily record. The totals for weekly, or monthly or yearly periods could be calculated if needed as well. The program starts logging automatically when run. Calibration and setup can only be done when the logging is stopped. Viewing data is possible at any time. If the current days Excel file is viewed with Excel, then data stored to the Excel log file will be suspended while the Excel file is open. This is a fault with Excel and not the logger. Avoid viewing the Excel files with Excel on the current days file. A copy .csv can always be created from within the Logging graph window, and this viewed with Excel. If anyone knows how to create a printable graph file, directly from within a Visual Basic App, then this would be a useful mod, but until then the print screen button, and pasting to another Application is the only way to get hard copy. I have not looked at this yet, but it may be useful. I have included many error checks on the COMM data, that cover as many potential problems I could imagine and test for, including incorrect baud rate selection and log hardware failure, and corrupt data, from missing XML encoding and additional characters, to a data checksum. The log files that appear in the graphing window, that can be clicked on to be graphed, are in chronological order, so the most recent files may become scrolled off the bottom of the window. The most recent file will be at the bottom of the list. I have not found a way of making the list reverse, so the most recent files are at the top. If anyone knows a way of fixing this, it could be a later mod. As I have said before, I am open to suggestions for other mods. I don't know in advance if any suggestions could be incorporated. I may look at a user preferences selection of graph colour. I hope a few of the readers using piclog will get to testing of this app979, and pass on any thoughts negative, or positive. Gordon. become more energy aware |
||||
