| |
  Page 4 of 4 Page 4 of 4 |
| Author |
Message |
niall1

Senior Member

Joined: 20/11/2008
Location: IrelandPosts: 331 |
| Posted: 05:22pm 17 Jul 2010 |
 Copy link to clipboard Copy link to clipboard |
 Print this post |
|
Hi Pete
i cant help thinking the cct could be listening in a bit to alien plans to invade the earth ...theres no shielding on any of the wires and its layout is not that compact or even it its own box.....
i think as long as i know the error factor and what makes it tick , i,m ok with it...everything its attached to has a fair amount off error built in it as well...
so it should feel right at home...
it seems to be able to give the tristar logger a good run for its money which is fun as well
this is a first run of Gordons new program as well....i,m not doing it justice but really appreciate he made the demo available (like the tristar it can log down to 2 sec)
the gloves are off then............(well ....at least a little bit)
Edited by niall1 2010-07-19
niall |
| |
GWatPE
Senior Member
Joined: 01/09/2006
Location: AustraliaPosts: 2127 |
| Posted: 12:57am 18 Jul 2010 |
Copy link to clipboard |
Print this post |
|
Hi Nial1,
Now you have the windmill analyzer, maybe you could post the graph of the power distribution that was recorded for the same interval. Readers see the spikey graph, and the maximum readings, but the real value is where the wind energy really occurs. The power distribution will be a negative exponential type series of bar graphs. Where most of the power occurs, will dictate the type of windmill that will be best, at that location.
This will be a single click on the distribution radio button in the box on the left.
The maximums for the displayed graph are available by clicking on the displayed value of the channel of interest. These are sticky, until the cursor is moved back over the graph window, so all the maximums can be displayed for a record shot. The battery voltage will toggle between the maximum and minimum. The maximums are recalculated for any zoom of the graph, to reflect the new graphed maximums.
The channel colours are user changeable, as is the channel name. These options are save for next time as well. Channels that are not available can be turned OFF, and the prefered channels to graph can be set as well. The channels to graph can only be a subset of the availale channels.
You will get a better picture of how well the windmill is performing now.
Gordon.
Edited by GWatPE 2010-07-19
become more energy aware |
| |
niall1
Senior Member
Joined: 20/11/2008
Location: IrelandPosts: 331 |
| Posted: 12:42pm 18 Jul 2010 |
Copy link to clipboard |
Print this post |
|
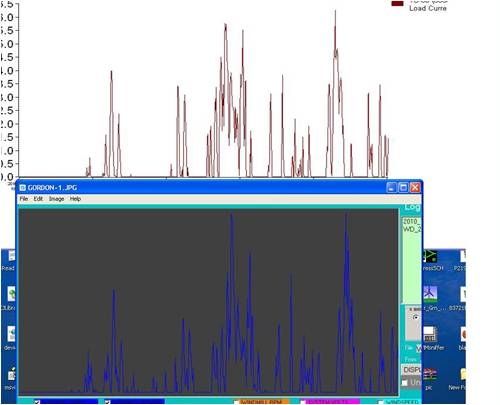
erm...i did see these graphs (not the rpm one as i dont have the rpm feature set up on the pic yet) and wondered how to read them...
heres another short log over one hour.....
now the other graph
i just ran the program for the first time yesterday on a separate pc and initially just looked at simple amp/V logs...i,d like to understand how to read that second graph ....
when i run some more signal wire to the mill ac hopefully i,ll get the other functions online
niall |
| |
GWatPE
Senior Member
Joined: 01/09/2006
Location: AustraliaPosts: 2127 |
| Posted: 02:10pm 18 Jul 2010 |
Copy link to clipboard |
Print this post |
|
Hi niall,
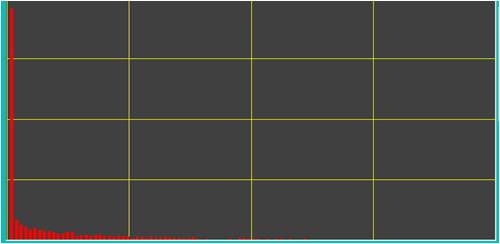
I assume that you have set the maximum expected power from your windmill in the Setup for logger hardware menu. The value selected, becomes the maximum for the X-axis range in the distribution graphing.
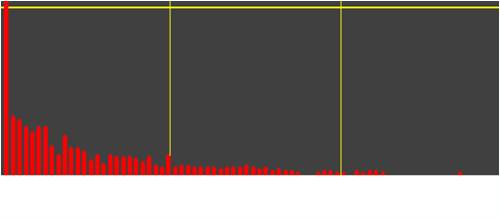
The position of the red indicates how good the wind location is. A good wind site will have little red towards the LHS, and a Gaussian distribution 2 tailed[Bell shape]. Most locations will have the negative exponential shape like you have presented. The more red to the RHS indicates a better wind location.
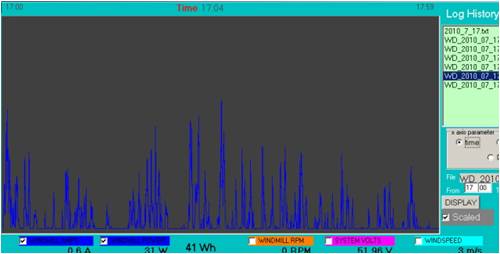
Here is a typical distribution from my location in medium wind for about 8 hours, providing about 1.5kWh of power.
The maximum power was about 750W. You can see that there are a few dots that go up to the 750W, but most of the action is down the bottom end. This is the nature of most wind in non ideal loations, like where most people live.
This was the logged data against time.
I have just noticed that the calculated Wh is not working any more, so there will need to be a revision. Oh well.
Gordon.
PS -: the poor state of the battery is evident. The voltage rises and falls rapidly with the windmill power. The battery is essentially at float, and is not discharged by any loading. The GTI bleeds OFF excess power back to the house and maybe back to the grid. Most is used in the house.
become more energy aware |
| |
niall1
Senior Member
Joined: 20/11/2008
Location: IrelandPosts: 331 |
| Posted: 03:39pm 18 Jul 2010 |
Copy link to clipboard |
Print this post |
|
mmm...i hadnt set the expected power level....but by luck it defaulted to good settings
amps...20
windmill power...1000
system...60
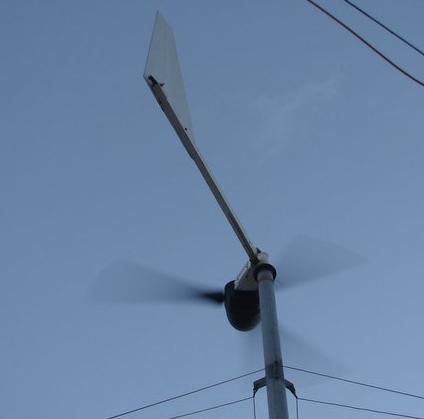
its a pretty much standard 1k 48v 3.6m Piggott machine at 10m
it took a while for the penny to drop looking at how the distribution points work..i think the graphs will be making pretty sobering reading.....the site has good winds but are ruined by turbulence to varying degrees
i think you may be about to end my romance with always looking at the high power spikes Gordon... Edited by niall1 2010-07-20 Edited by niall1 2010-07-20
niall |
| |
GWatPE
Senior Member
Joined: 01/09/2006
Location: AustraliaPosts: 2127 |
| Posted: 09:39am 19 Jul 2010 |
Copy link to clipboard |
Print this post |
|
Hi Niall,
This is not really related to your help with a shunt, however it follows from above.
I was initially lured into chasing the big numbers. I have indeed been guilty of publishing on this forum as well, as I did feel it was important at the time. The reality seems to be to make the biggest bladeset that can be stalled by the alternator, and set the furling so it will never get out of control. I am in the process of upgrading my electrical wiring to accomodate the needs of my new AxFx mill. This is following my findings of flying the biggest rotor possible. I am not the first to finally see this principle. I think Oztules has mentioned this as well in his own way. At the end of the day my own windmills need to be self limiting with automatic shutdown systems. I want my own windmills to last a long time, and as long as the automatics are fail safe, and the windmills produce power in the major part of the wind energy spectrum then I am prepared to forego the peak power. I don't see a lot of point now in designing a system to cope with peaks 4-5x bigger than really is needed most of the time.
I think the biggest problems stem from the GTI systems that seem to be pushed these days. I have a GTI loading, and if it wasn't for the solar, it would be a significantly under utilized component. I guess that many might argue that any GTI, even for solar is a significantly under utilized component, as most of the day it is either OFF[at night] or under maximum capacity. My wind connected GTI should be paid OFF in about another 2 years, so after that it won't matter.
When you finally get rpm sorted, you will really see how well the windmill is working.
Gordon.
become more energy aware |
| |
| |
Page 4 of 4 |
